Home > Looker Studio Templates > SEO Customer Journey Looker Studio Template
SEO Customer Journey Looker Studio Template (GA4 + GSC)
36 pages of data! Elevate your SEO strategy and visualize your data in new and informative ways with this Looker Studio template. It’s been crafted to provide a comprehensive and high-level view of the entire customer journey. Ideal for digital marketers, SEO professionals, and business owners, this powerful tool delivers deep insights into key metrics such as visibility, attribution, audience, and engagement.
SEO Looker Studio Overview & Sections
Harnessing the power of Google Analytics 4 (GA4) and Google Search Console (GSC), this SEO Customer Journey Looker Studio template simplifies complex SEO analytics to empower you to strategically plan and execute your SEO efforts. Make data-driven decisions that enhance user engagement, optimize content, drive higher conversions, and boost overall performance.
Executive Dashboards
The Executive Dashboards section provides a high-level overview of your SEO performance, helping you quickly identify key insights and share with clients and/or leadership. This section includes the following comprehensive slides:
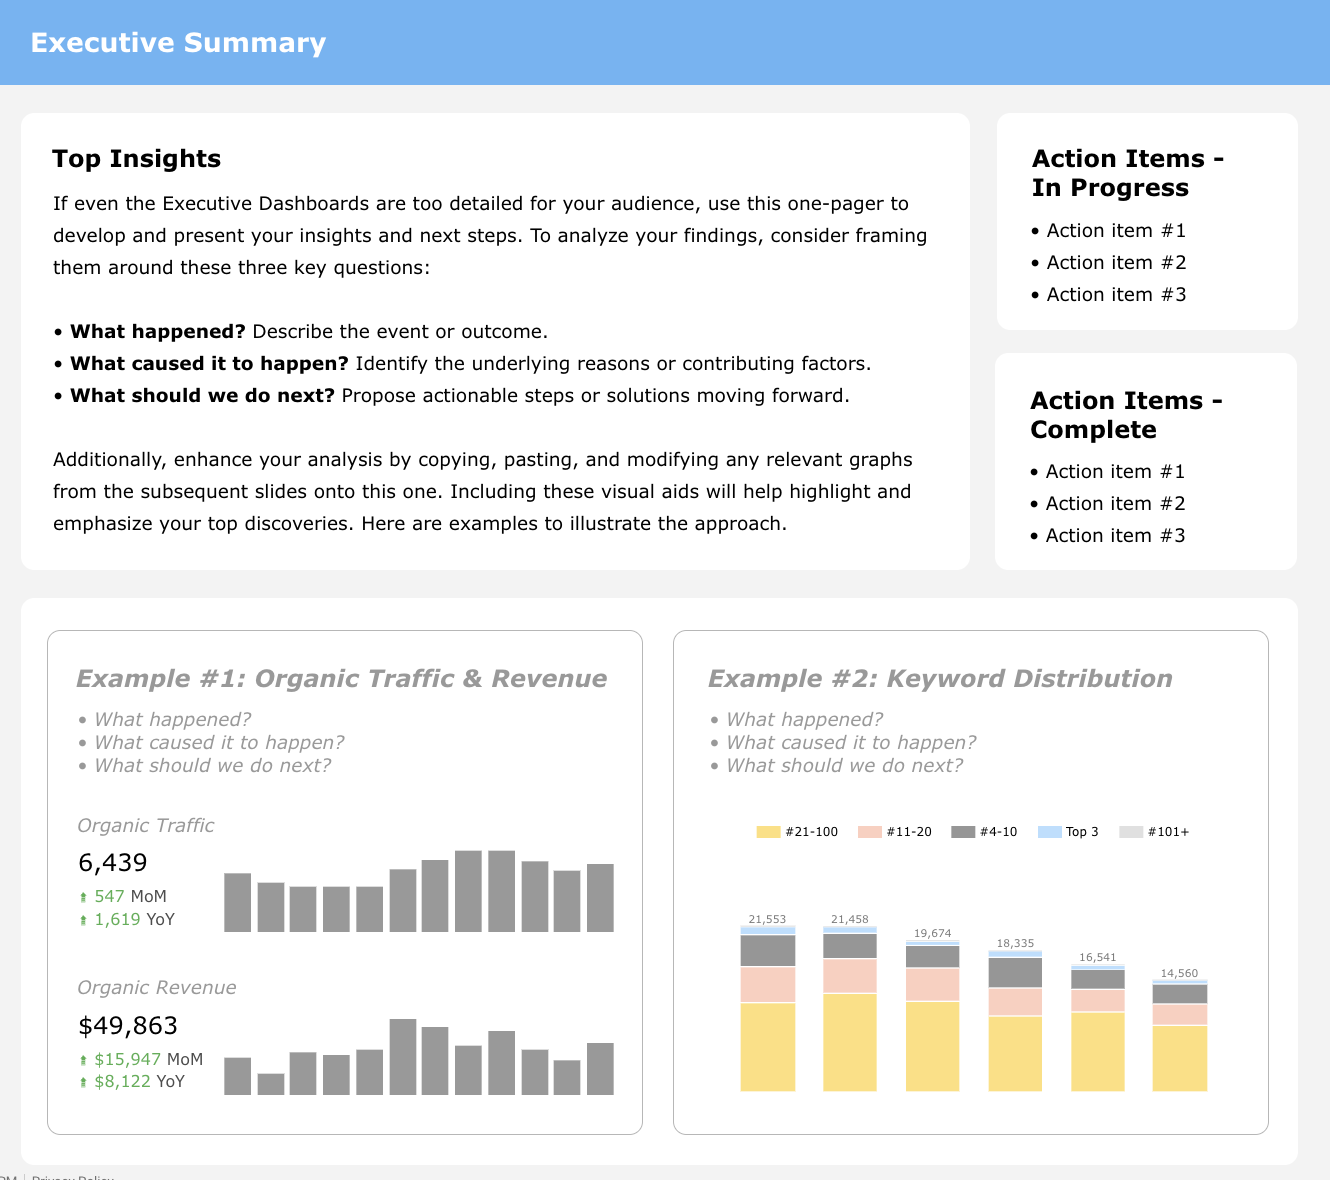
1. Executive Summary
Provide a concise overview of key SEO metrics. Tailored for leadership, it allows you to incorporate your own insights and track the progress of action items, providing a streamlined, one-page summary of the most critical information.
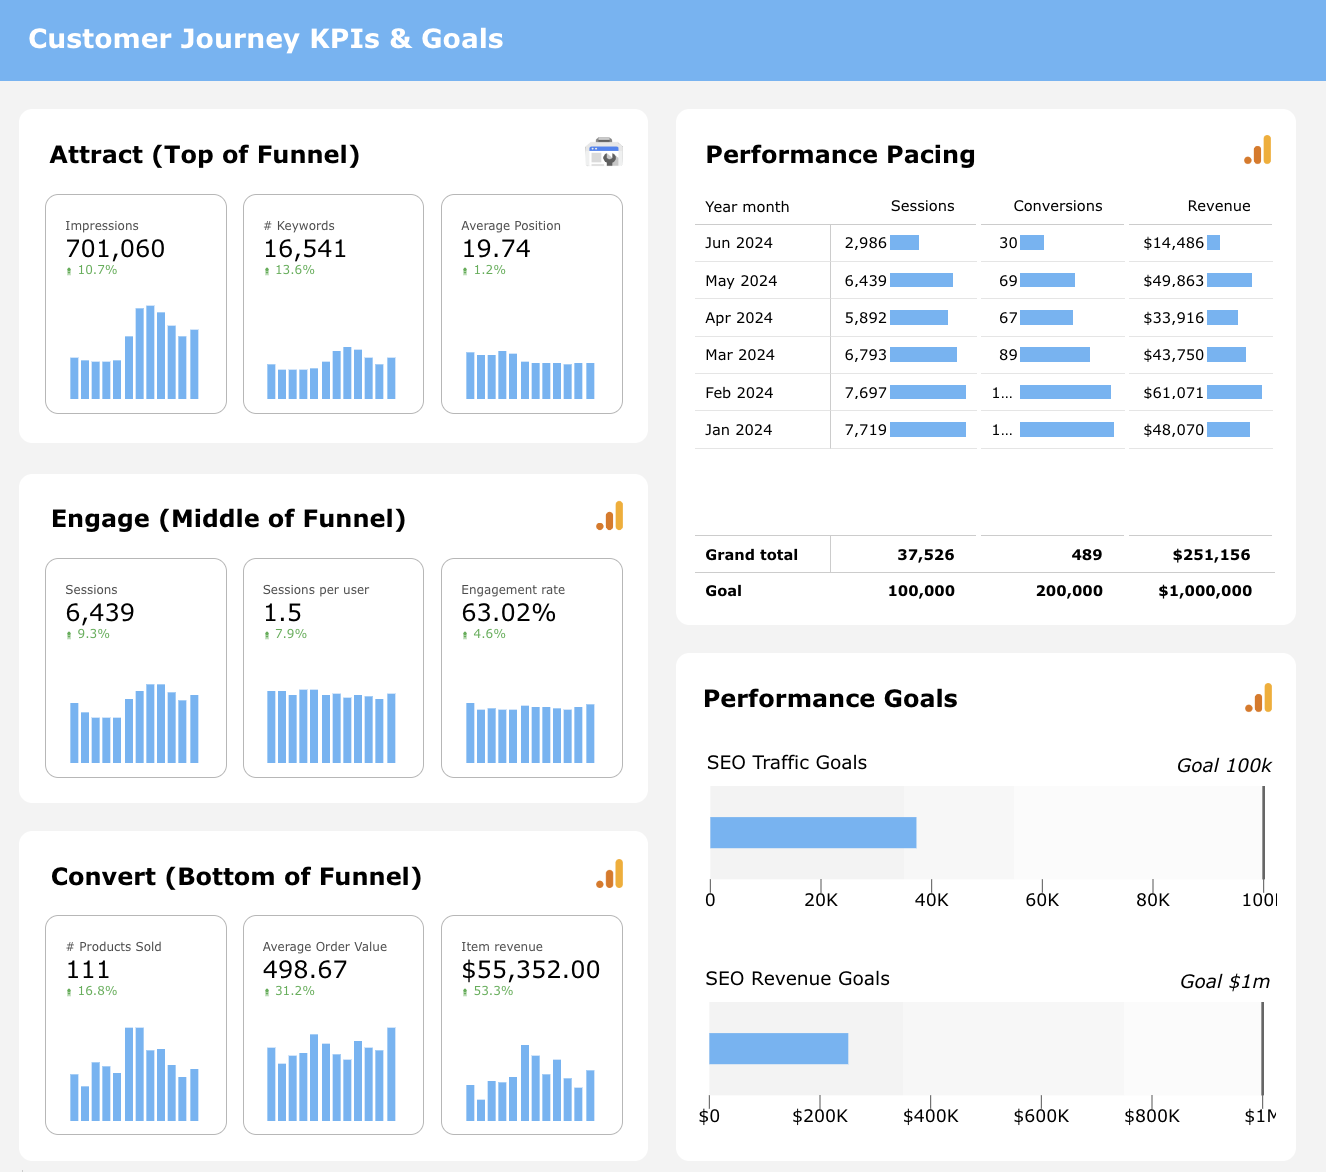
2. Customer Journey KPIs & Goals
Monitor your progress with detailed metrics and goals across different stages of the customer journey. Track key performance indicators to ensure your SEO strategy aligns with your business objectives.
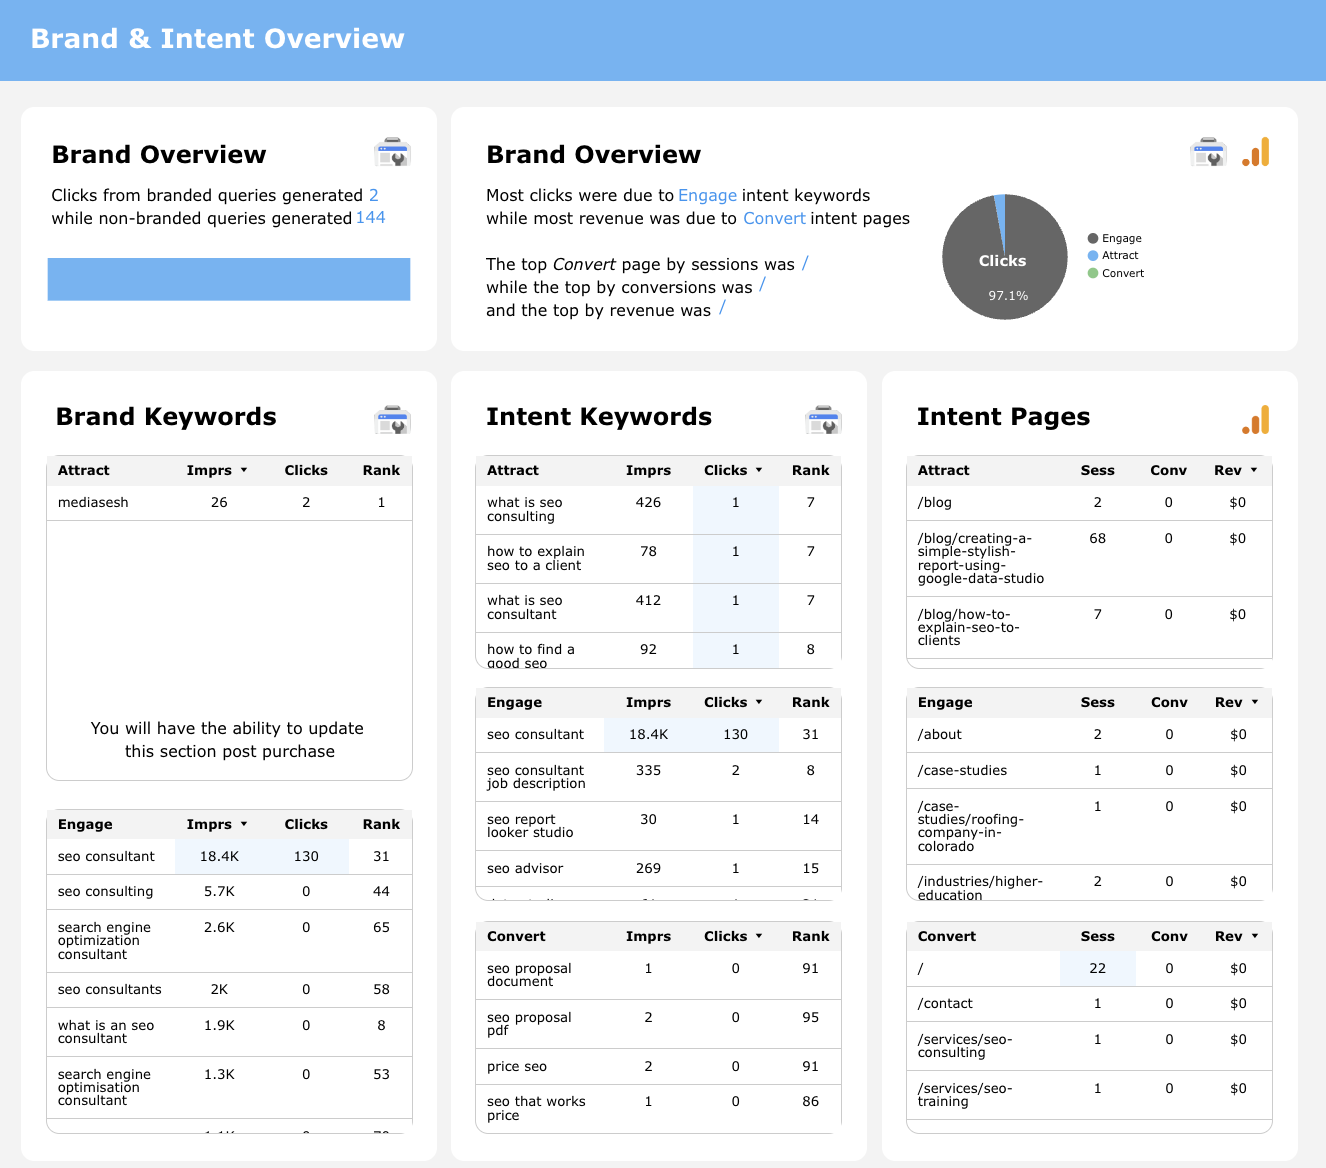
3. Brand & Intent Overview
Gain insights into branded and non-branded search performance, understanding how your brand is perceived and how different search intents impact your visibility and traffic.
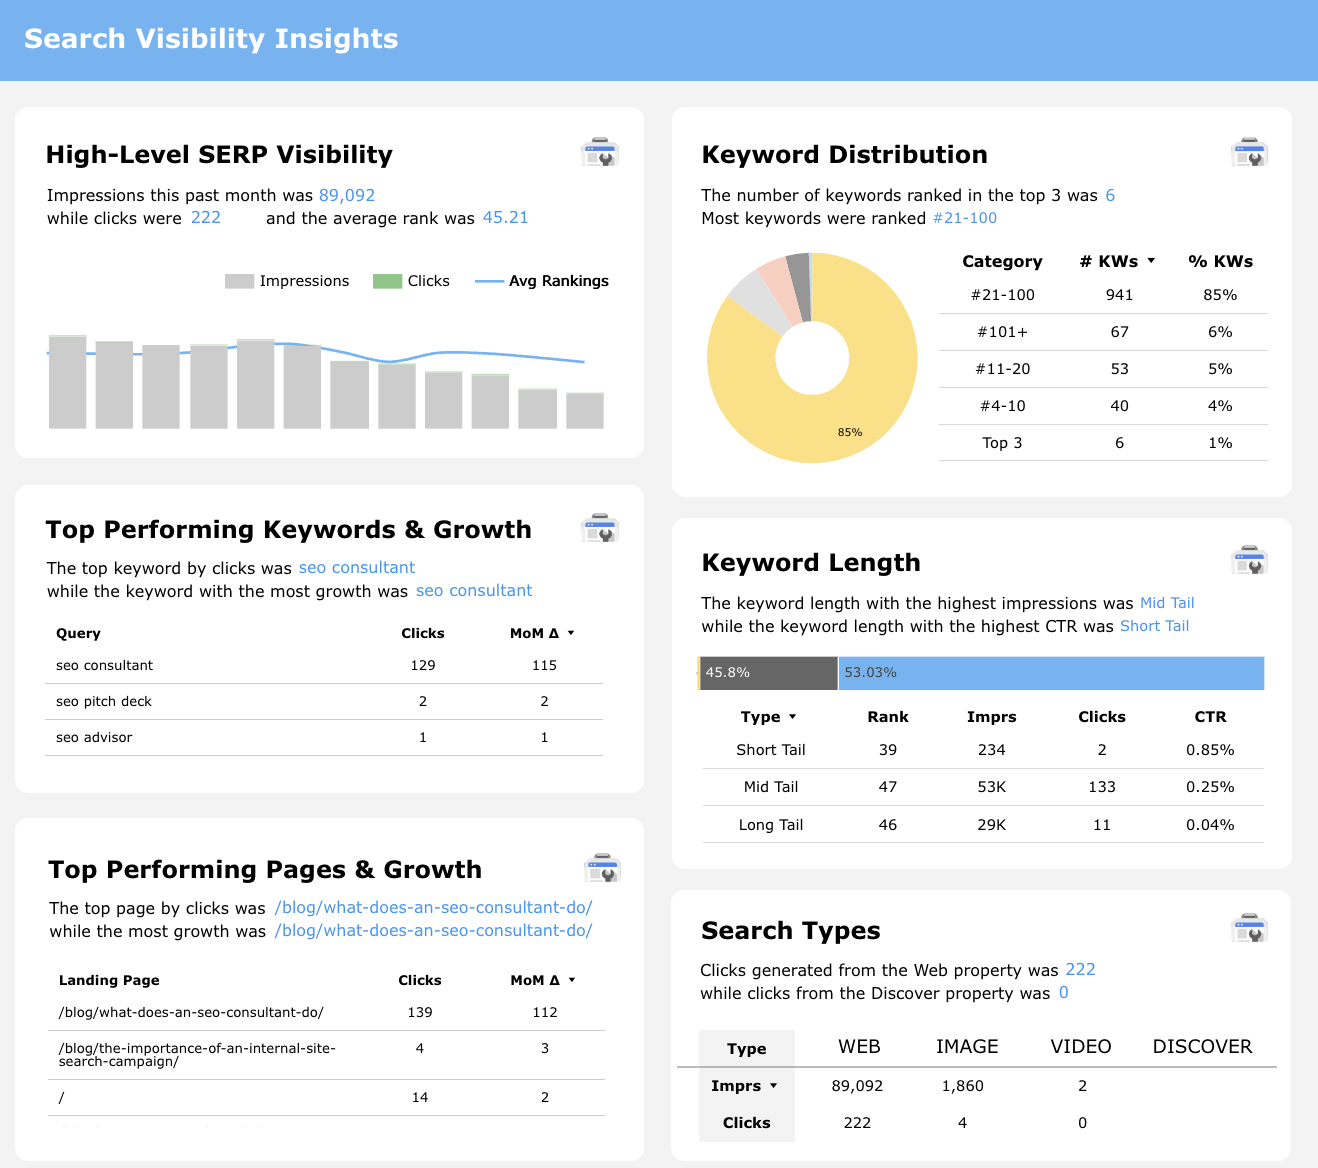
4. Search Visibility Insights
Analyze your search engine visibility with detailed metrics on impressions, clicks, and average rankings. Identify trends and opportunities to enhance your search performance.
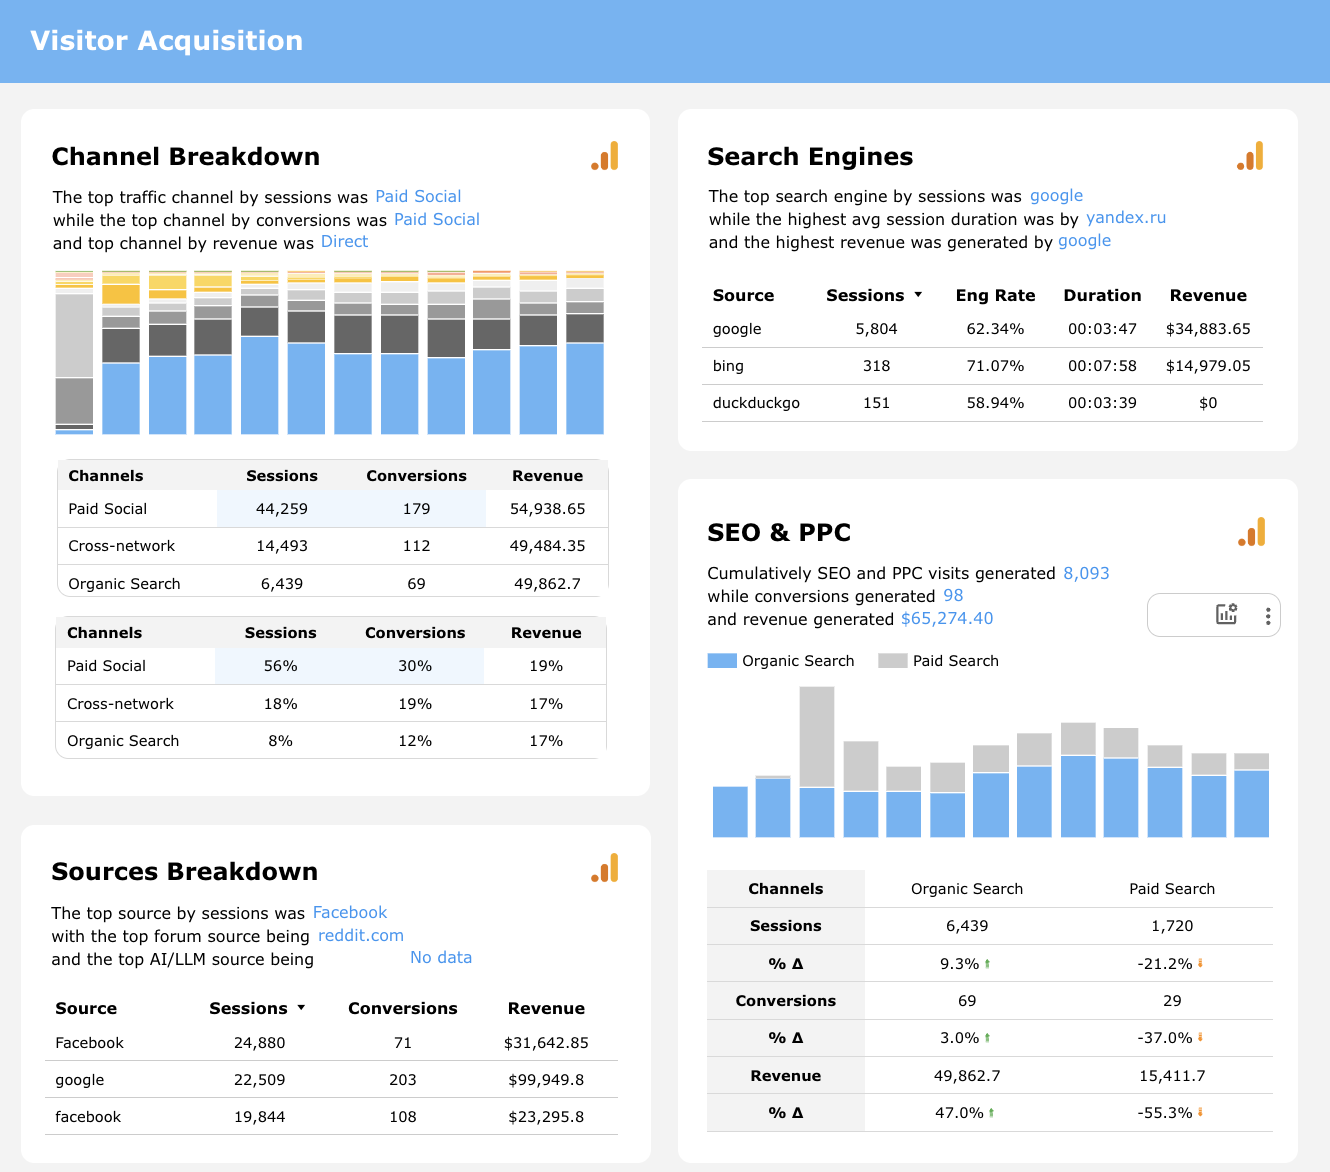
5. Visitor Acquisition
Understand how visitors are finding your website through various channels. Compare the performance of SEO and PPC, and evaluate the contribution of different sources to your overall traffic and conversions.
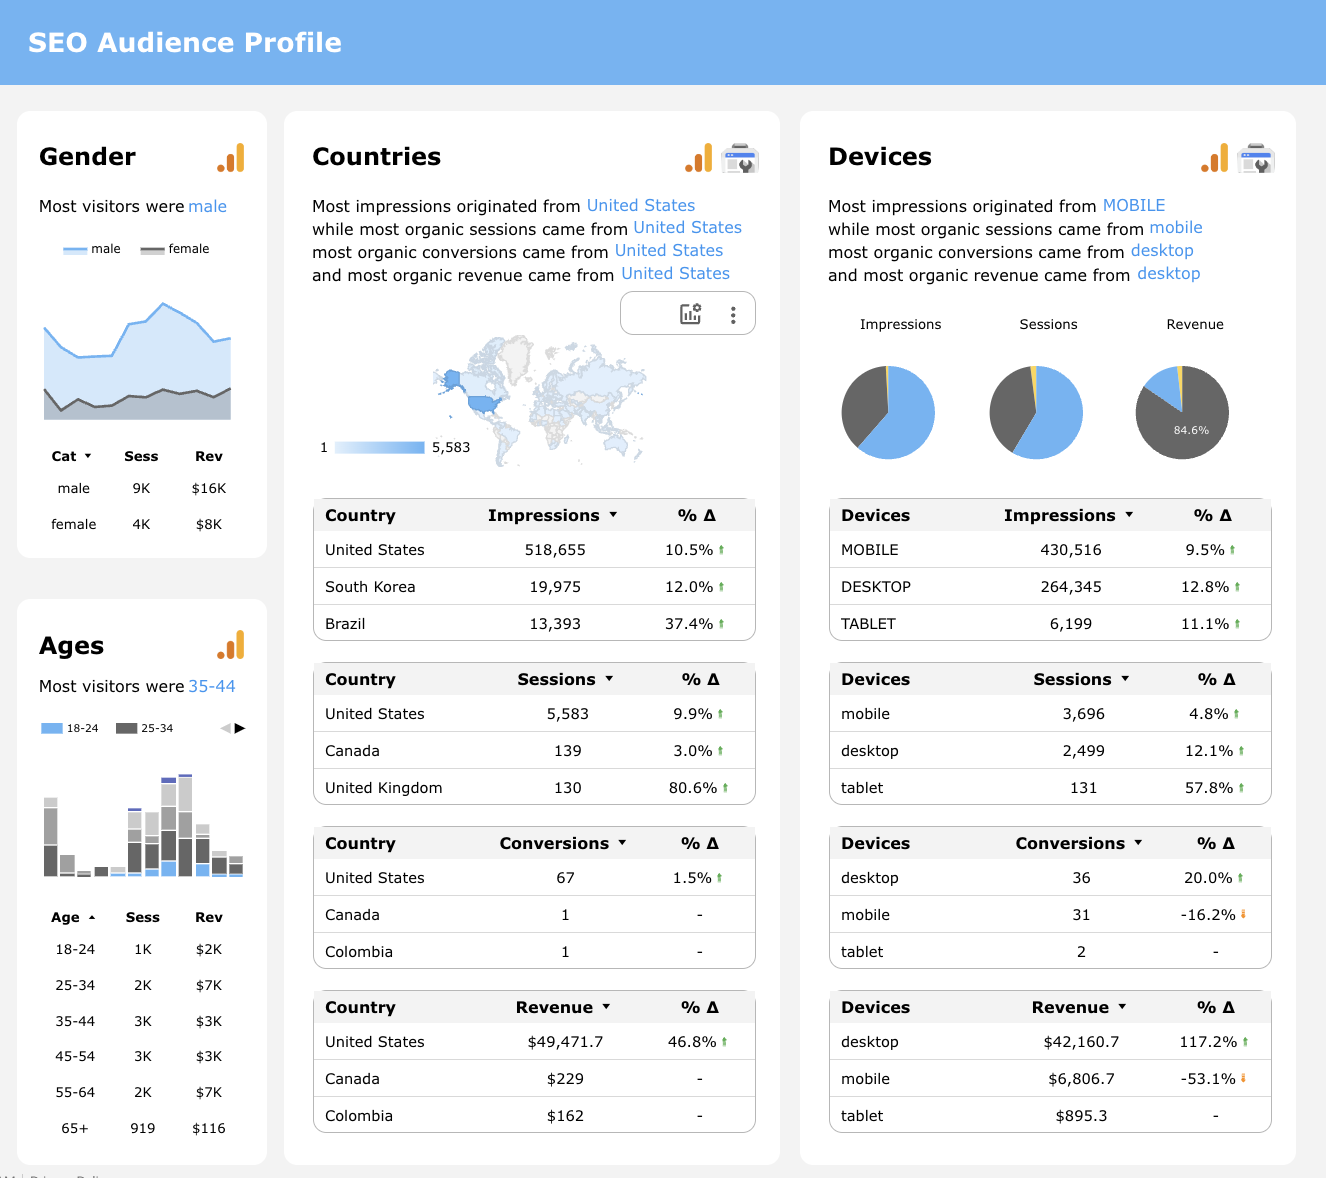
6. SEO Audience Profile
Get a detailed view of your website visitors, including demographics such as gender, age, location, and device type. Use these insights to tailor your content and marketing strategies to better meet the needs of your audience.
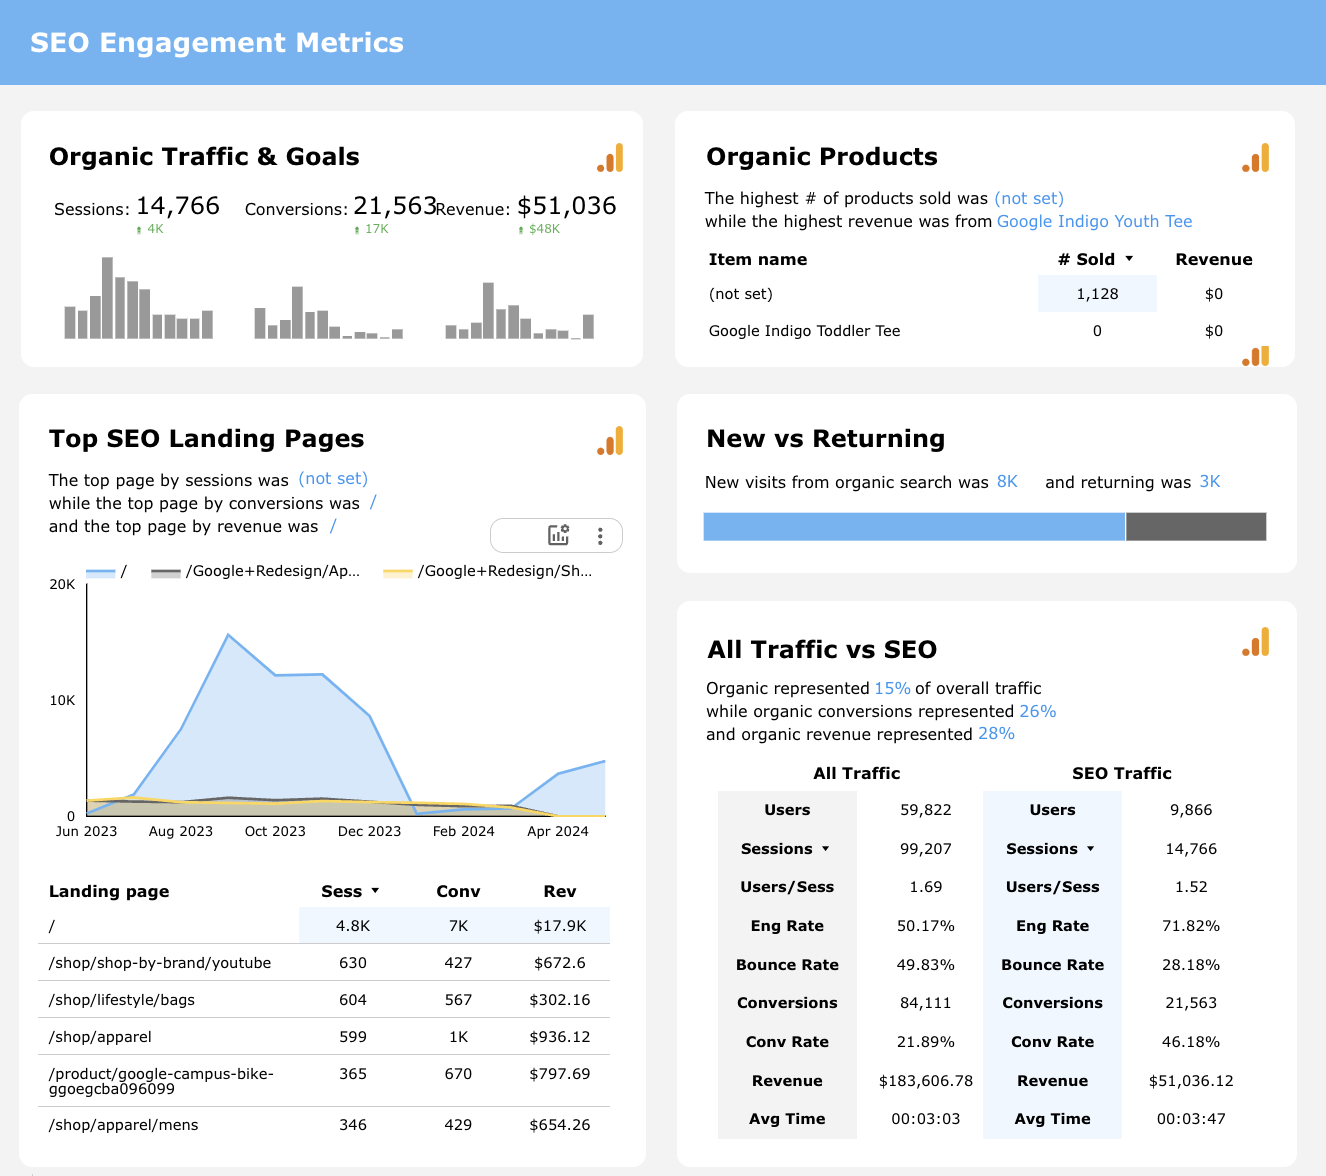
7. SEO Engagement Metrics
Evaluate user interactions with your website, including sessions, conversions, and revenue. Track engagement trends, compare new vs. returning visitors, and identify top-performing landing pages and products.
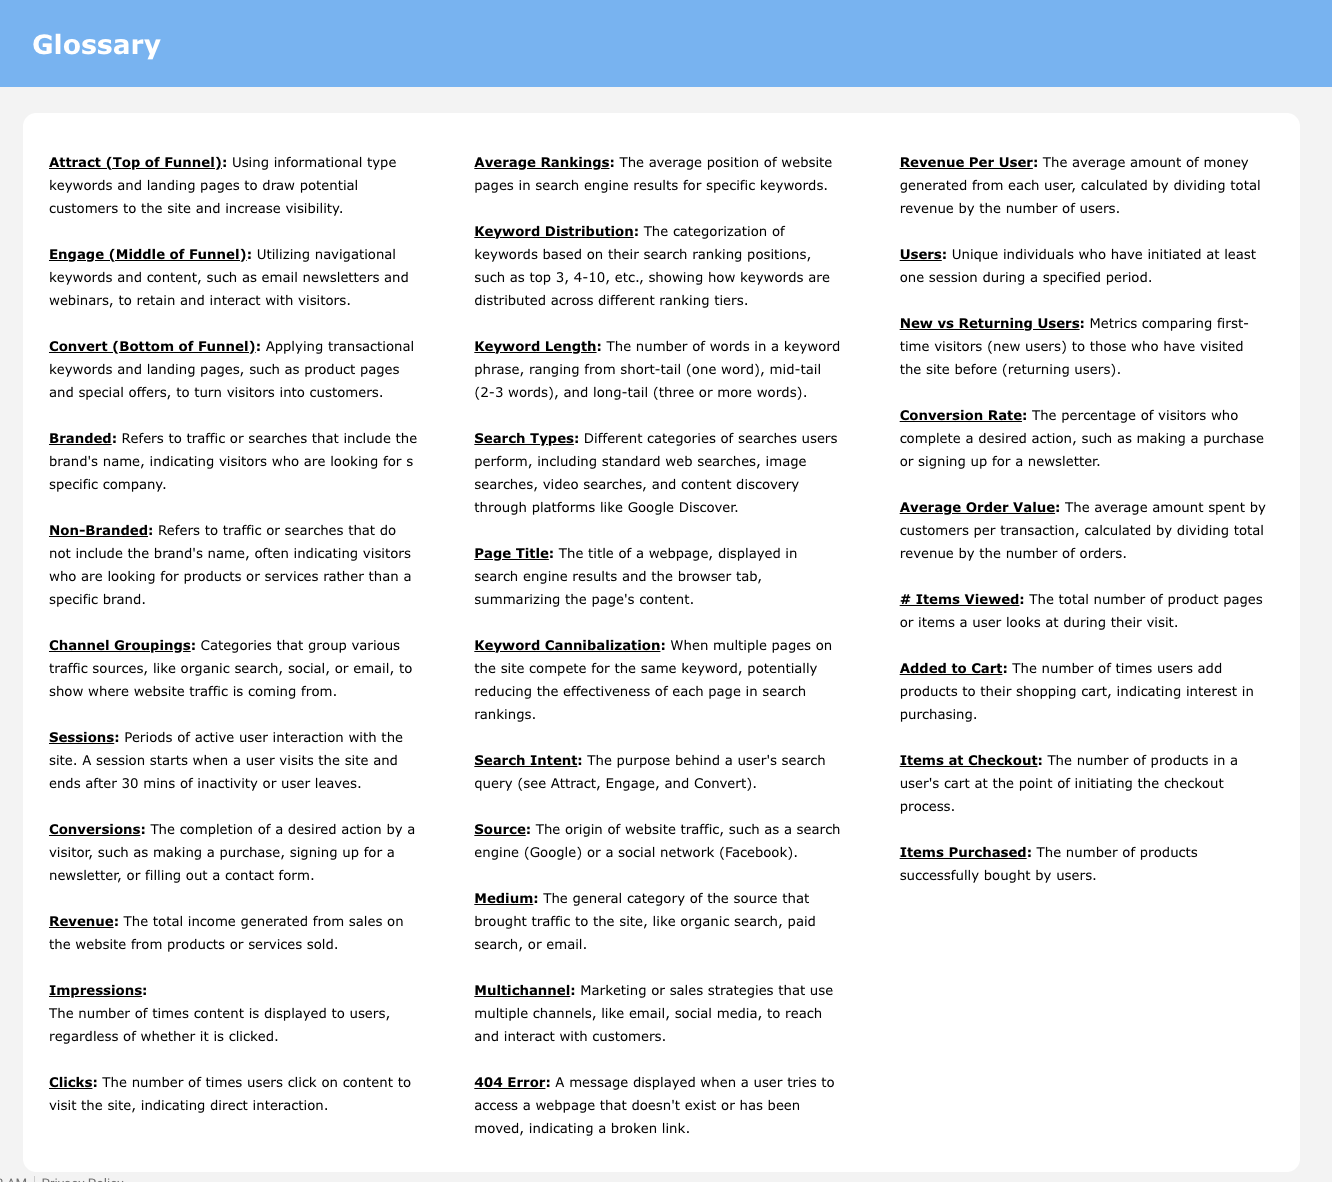
8. Glossary
This slide provides clear definitions of key terms and metrics, ensuring you and your team have a shared understanding of the data and insights presented.
Visibility Performance
The Visibility Performance section provides detailed insights into how your website and content are performing in search engines. This section includes the following comprehensive slides:
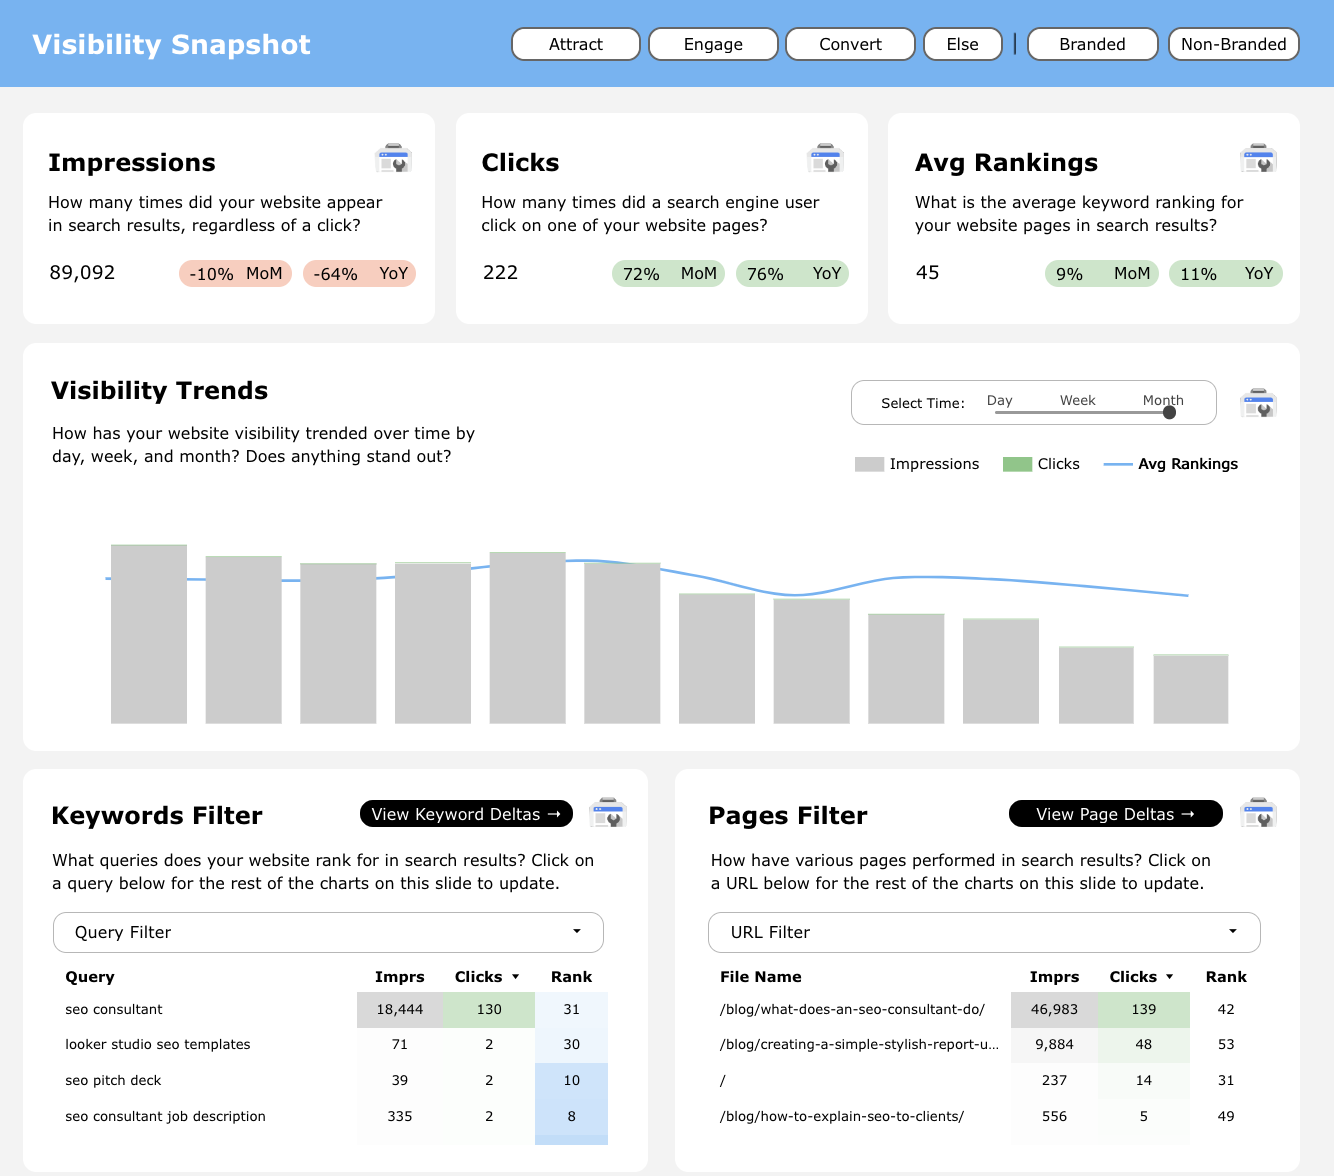
1. Visibility Snapshot
Get a high-level overview of your website’s visibility in search results. This slide shows key metrics such as impressions, clicks, and average rankings, helping you understand your overall search performance at a glance.
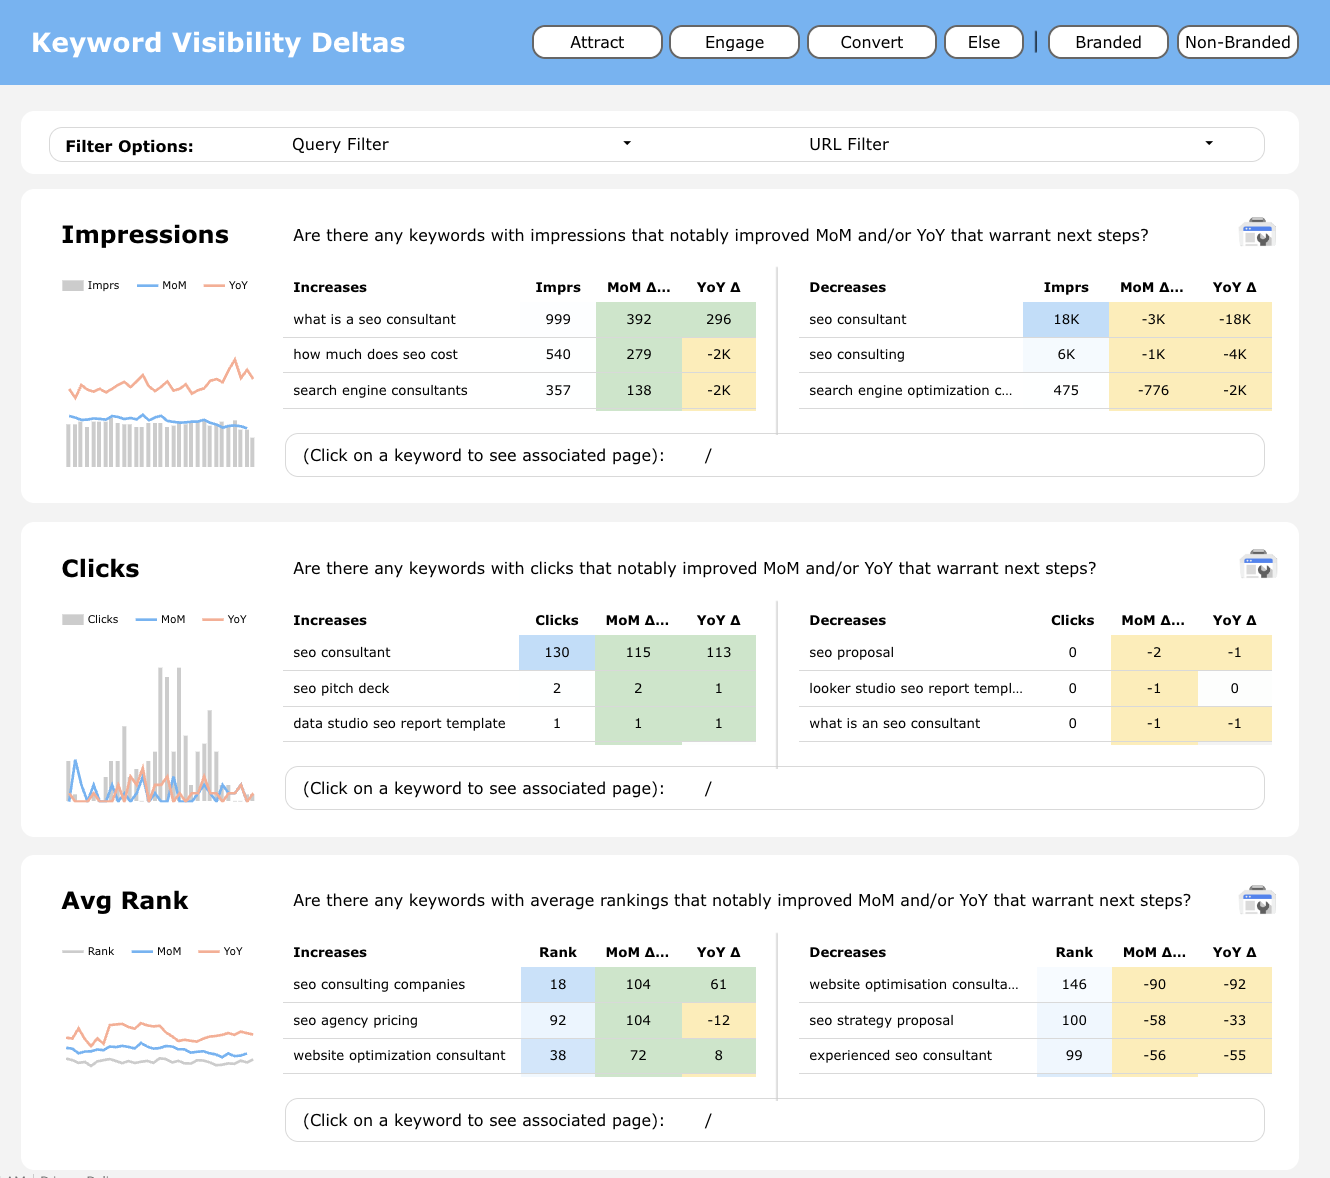
2. Keyword Visibility Deltas
Track changes in keyword performance over time with detailed metrics on impressions, clicks, and average rankings. Identify which keywords are gaining or losing visibility and adjust your strategy accordingly.
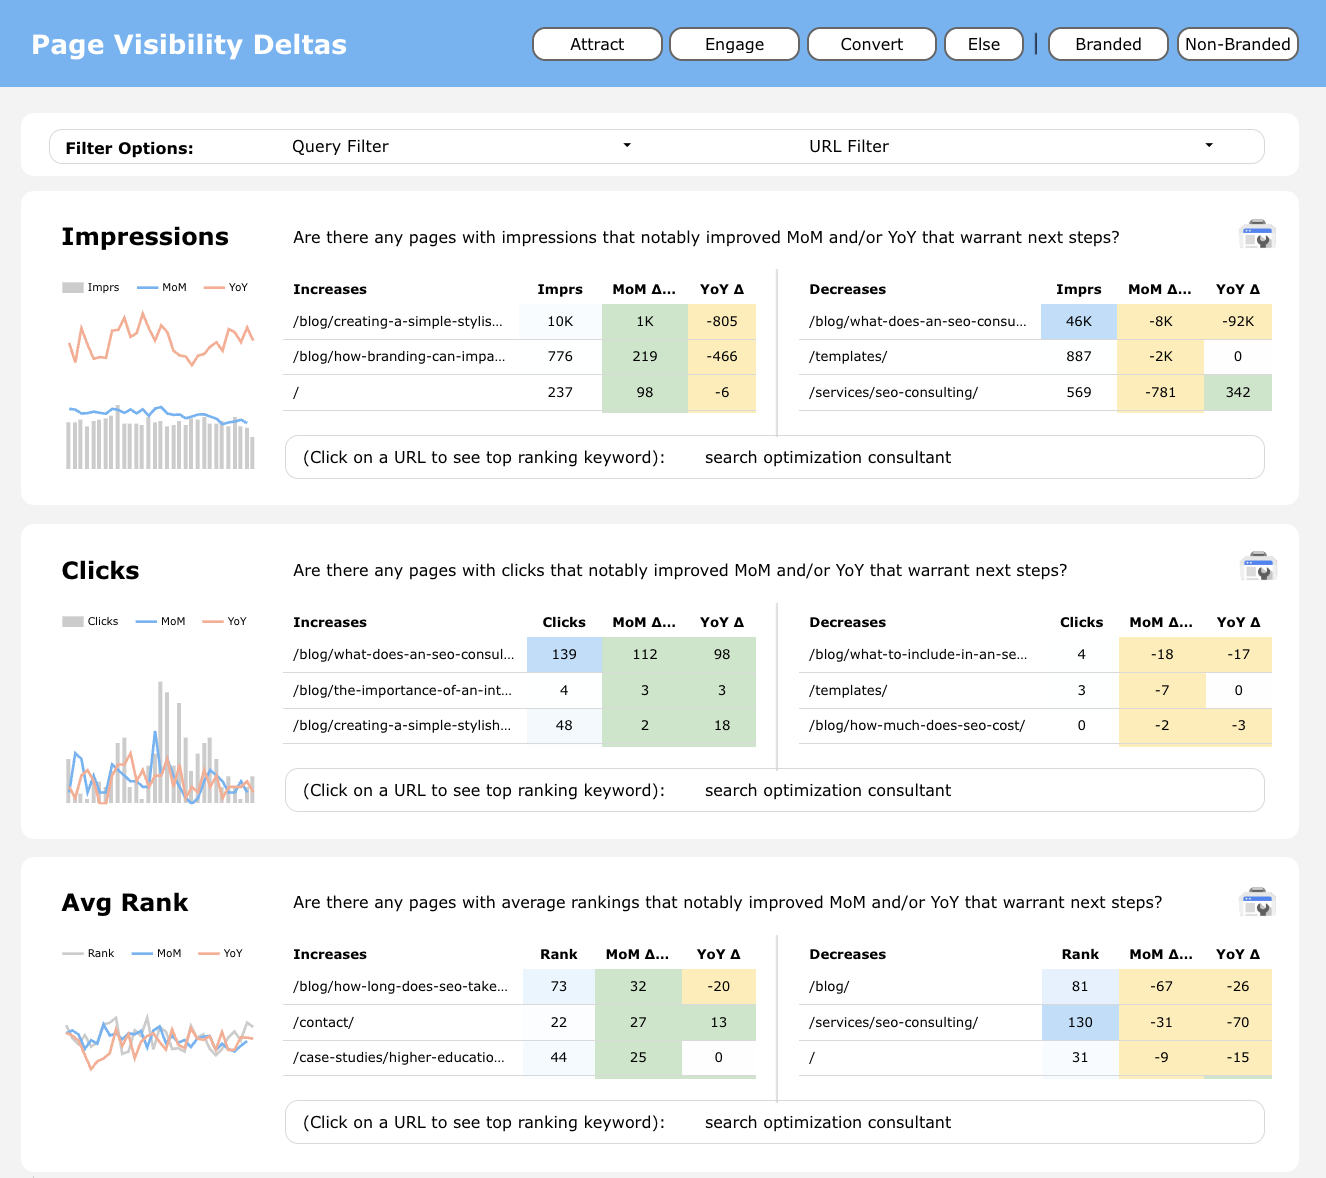
3. Page Visibility Deltas
Analyze changes in the performance of individual pages with metrics on impressions, clicks, and average rankings. Understand which pages are improving or declining in visibility and make data-driven decisions to optimize your content.
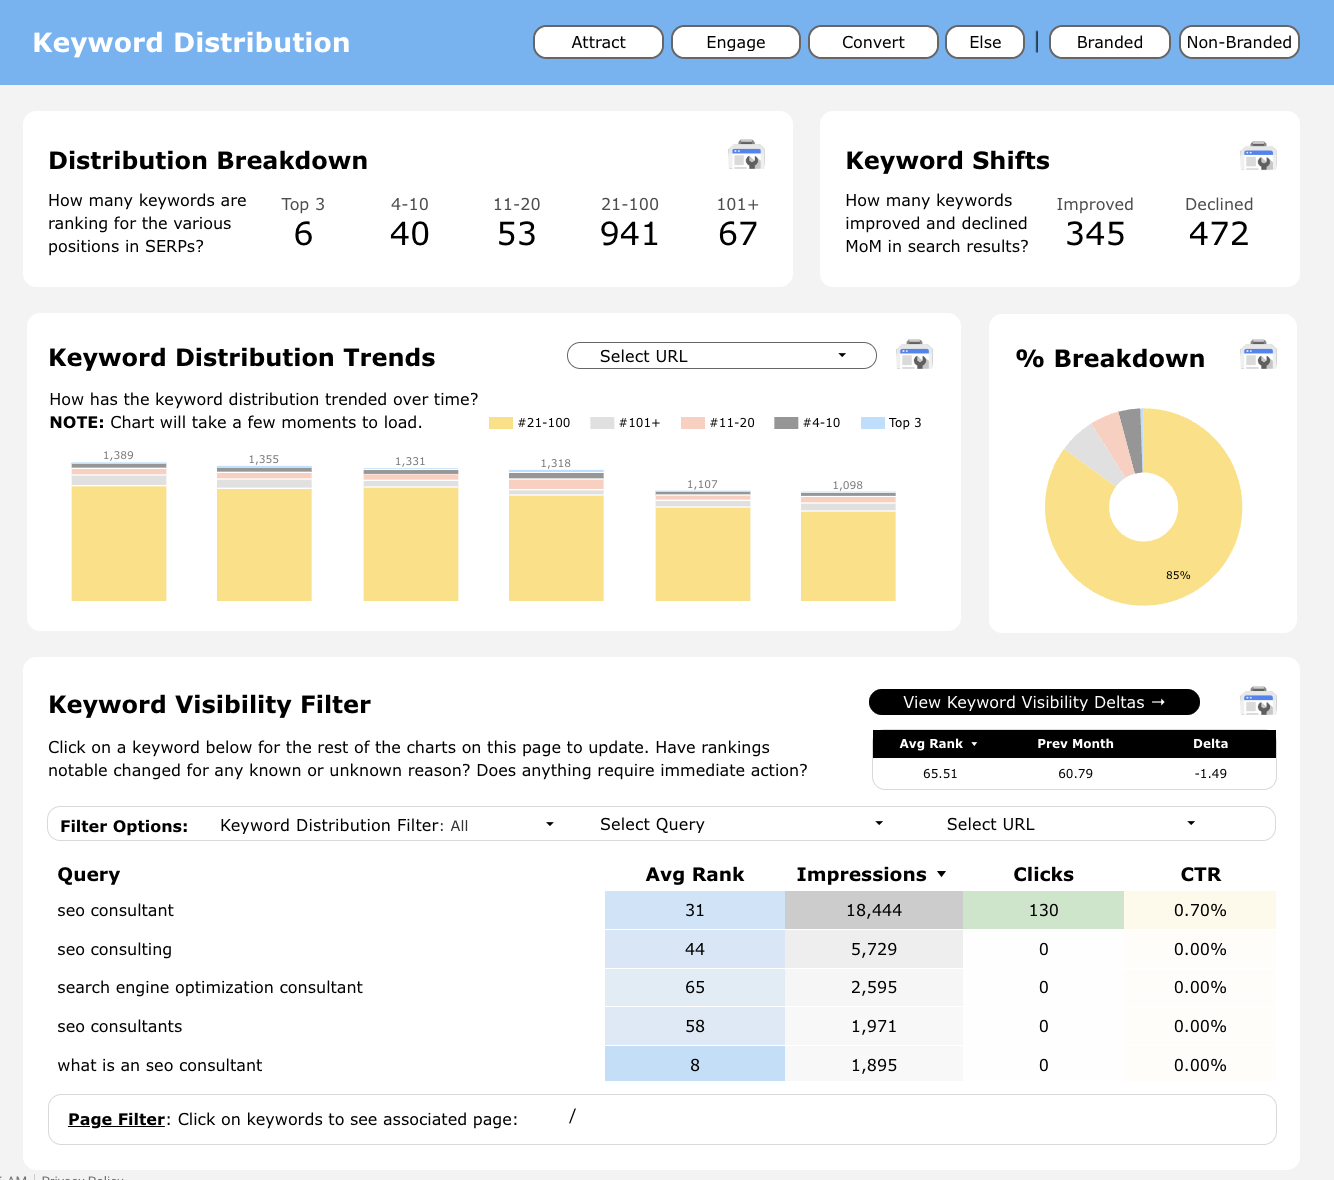
4. Keyword Distribution
Examine the distribution of your keywords across different ranking positions. This slide helps you understand where your keywords are positioned in search results, highlighting opportunities to improve rankings and increase visibility.
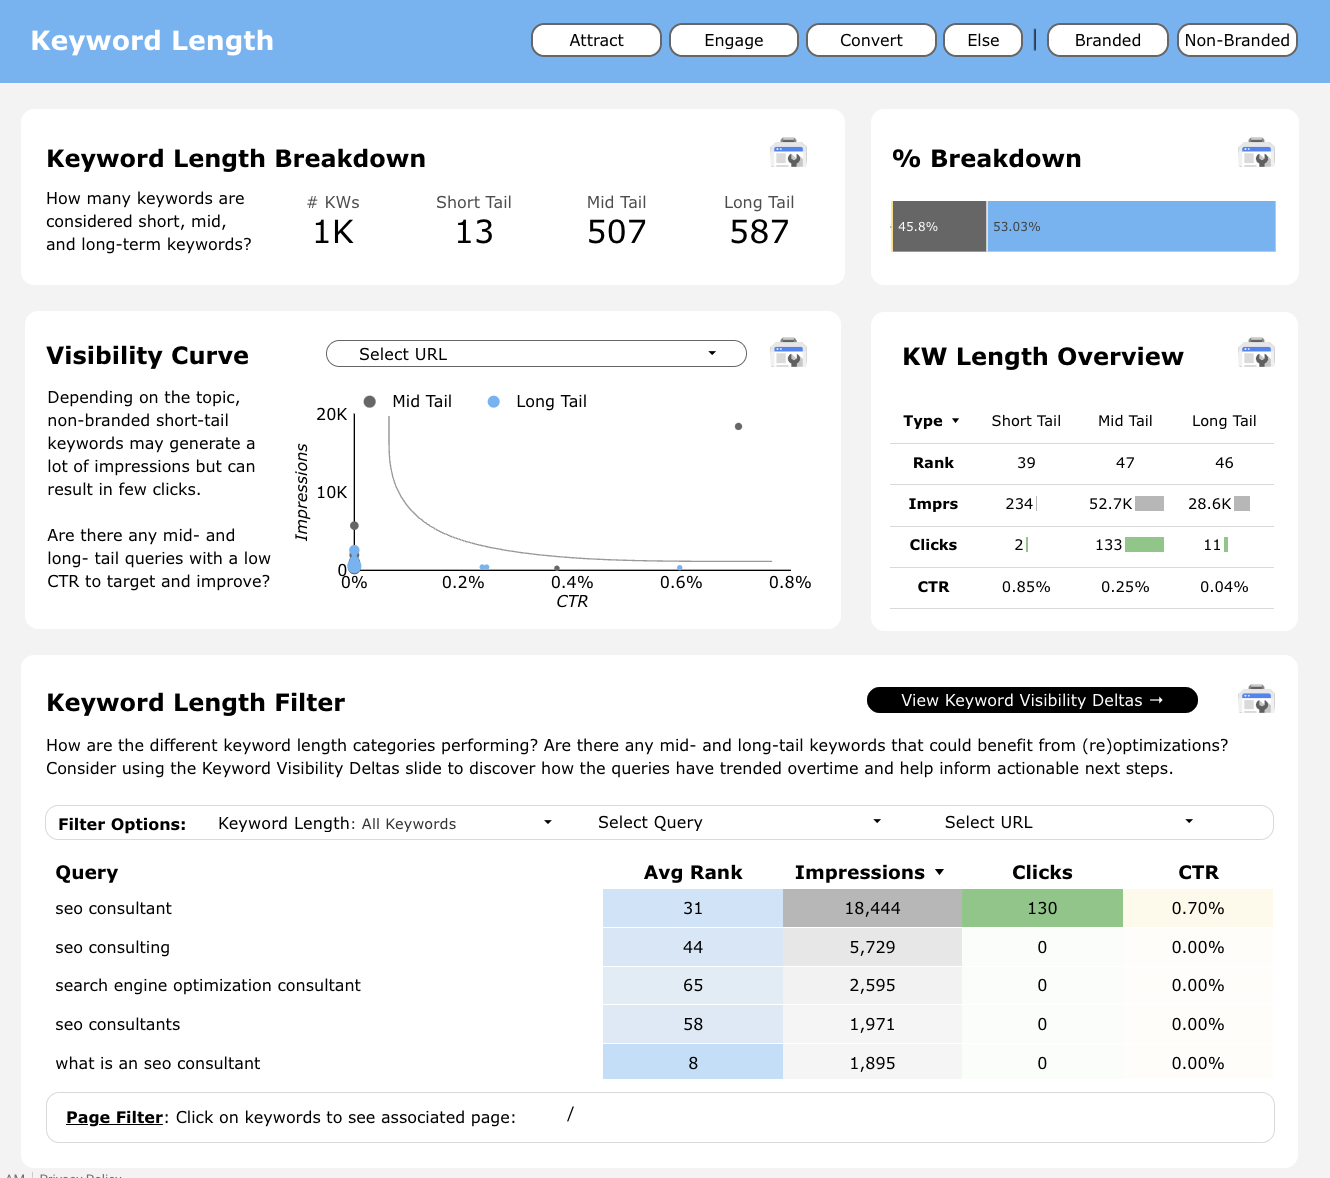
5. Keyword Length
Explore the performance of your keywords based on their length. This slide provides insights into how short-tail, mid-tail, and long-tail keywords are performing, allowing you to refine your keyword strategy for better results.
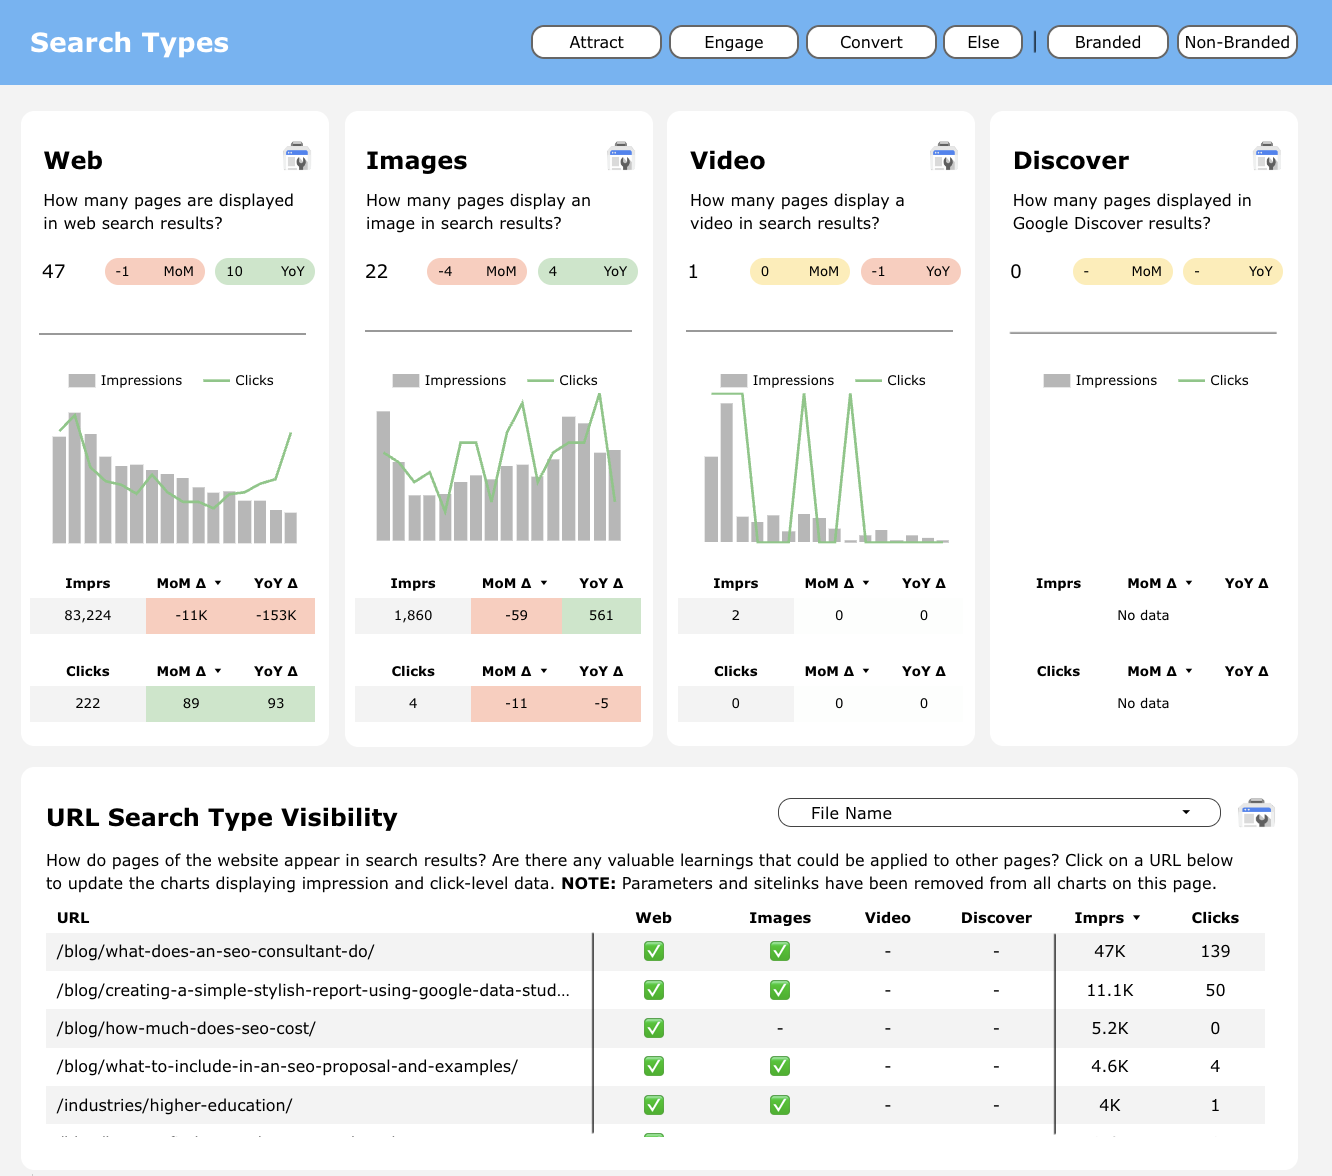
6. Search Types
Understand how your content performs across different search types, such as web, images, video, and Google Discover. This slide breaks down impressions and clicks by search type, helping you optimize your content for diverse search experiences.
Visibility Refinement
The Visibility Refinement section focuses on fine-tuning your SEO strategy by analyzing and optimizing specific elements of your website’s performance. This section includes the following comprehensive slides:
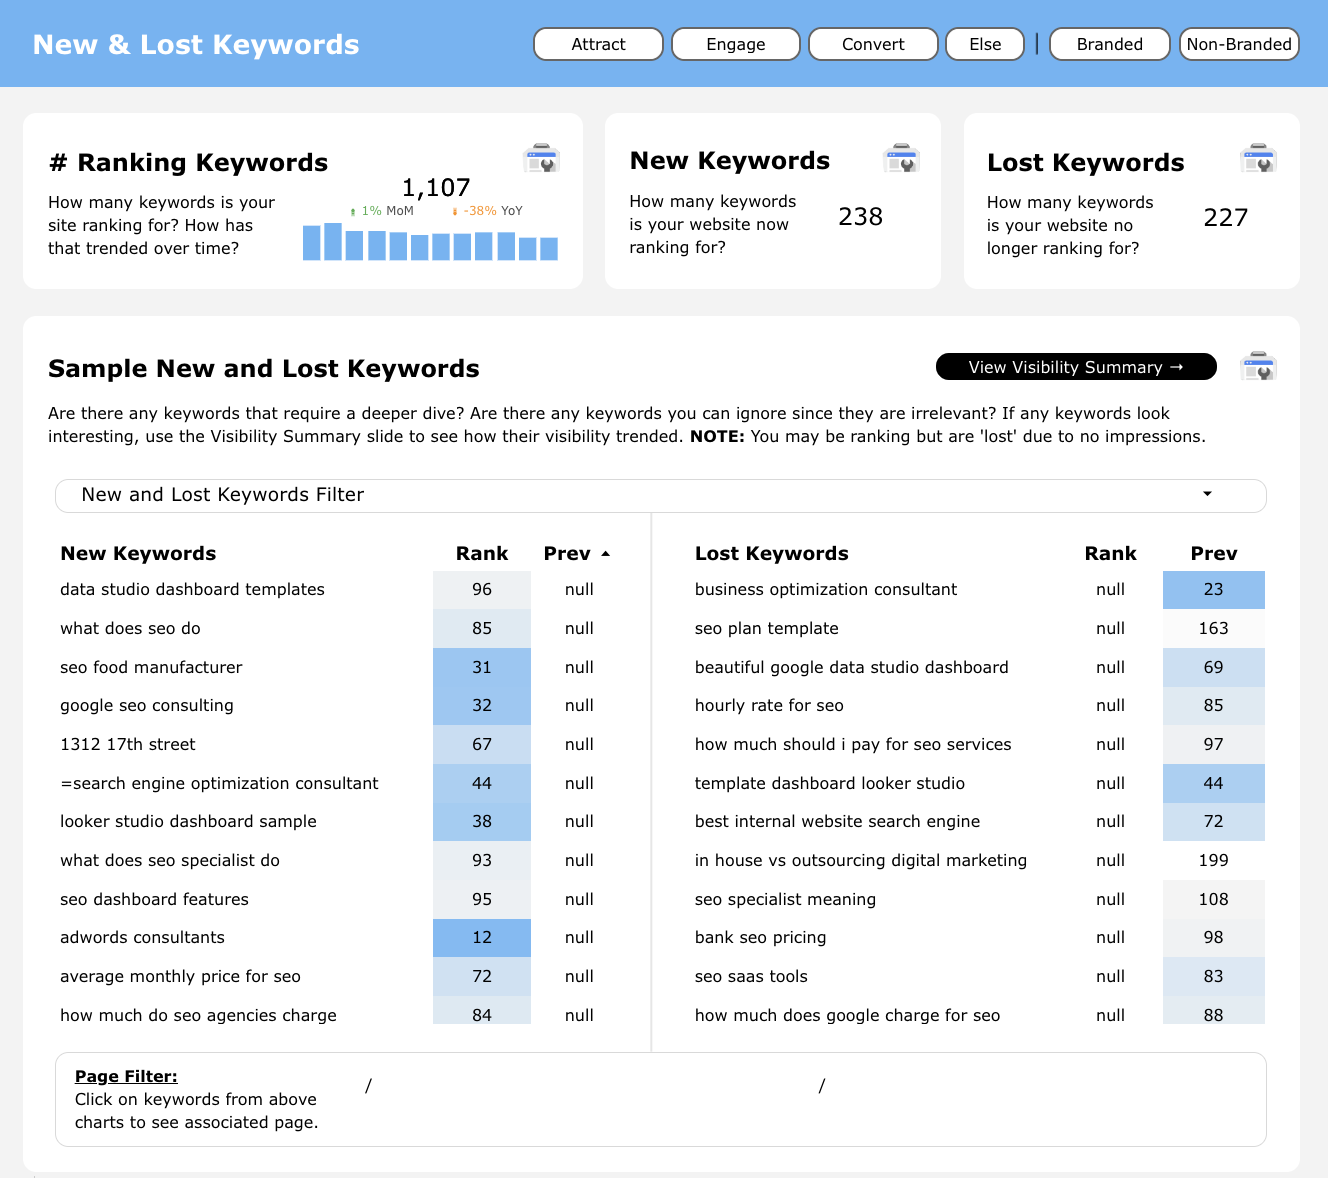
1. New & Lost Keywords
Track the emergence and disappearance of keywords in your search performance. This slide helps you identify new opportunities and understand which keywords you may need to re-target or adjust.
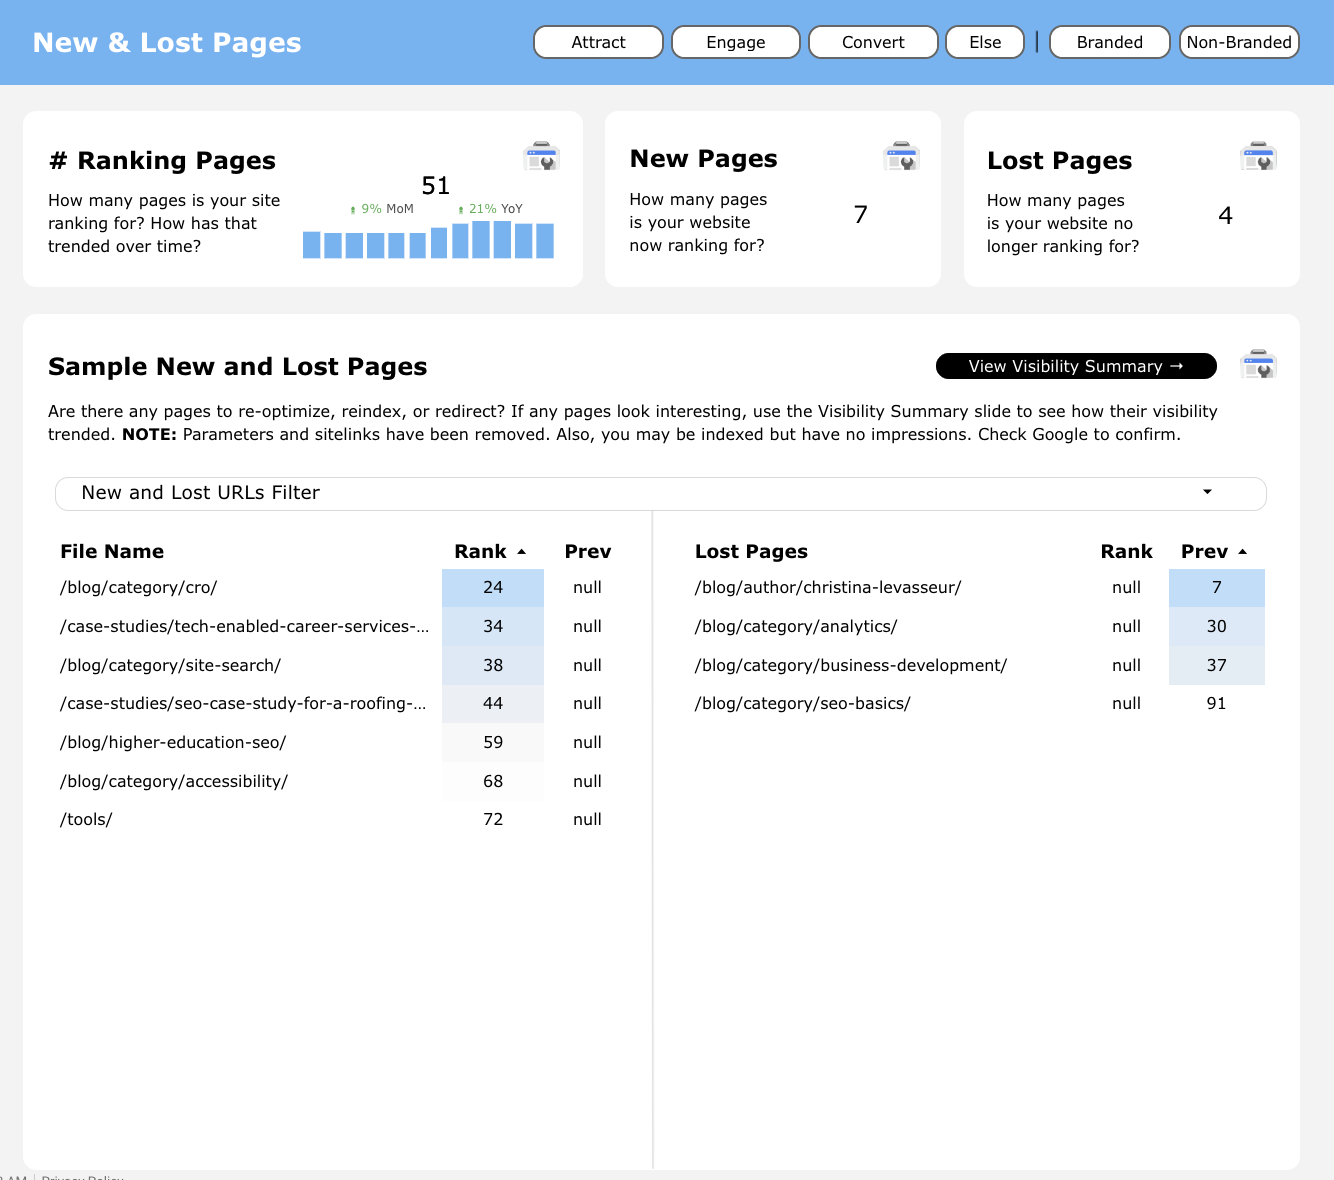
2. New & Lost Pages
Monitor the addition and loss of pages in search engine results. Understand which new pages are gaining visibility and which ones are dropping out, enabling you to refine your content strategy effectively.
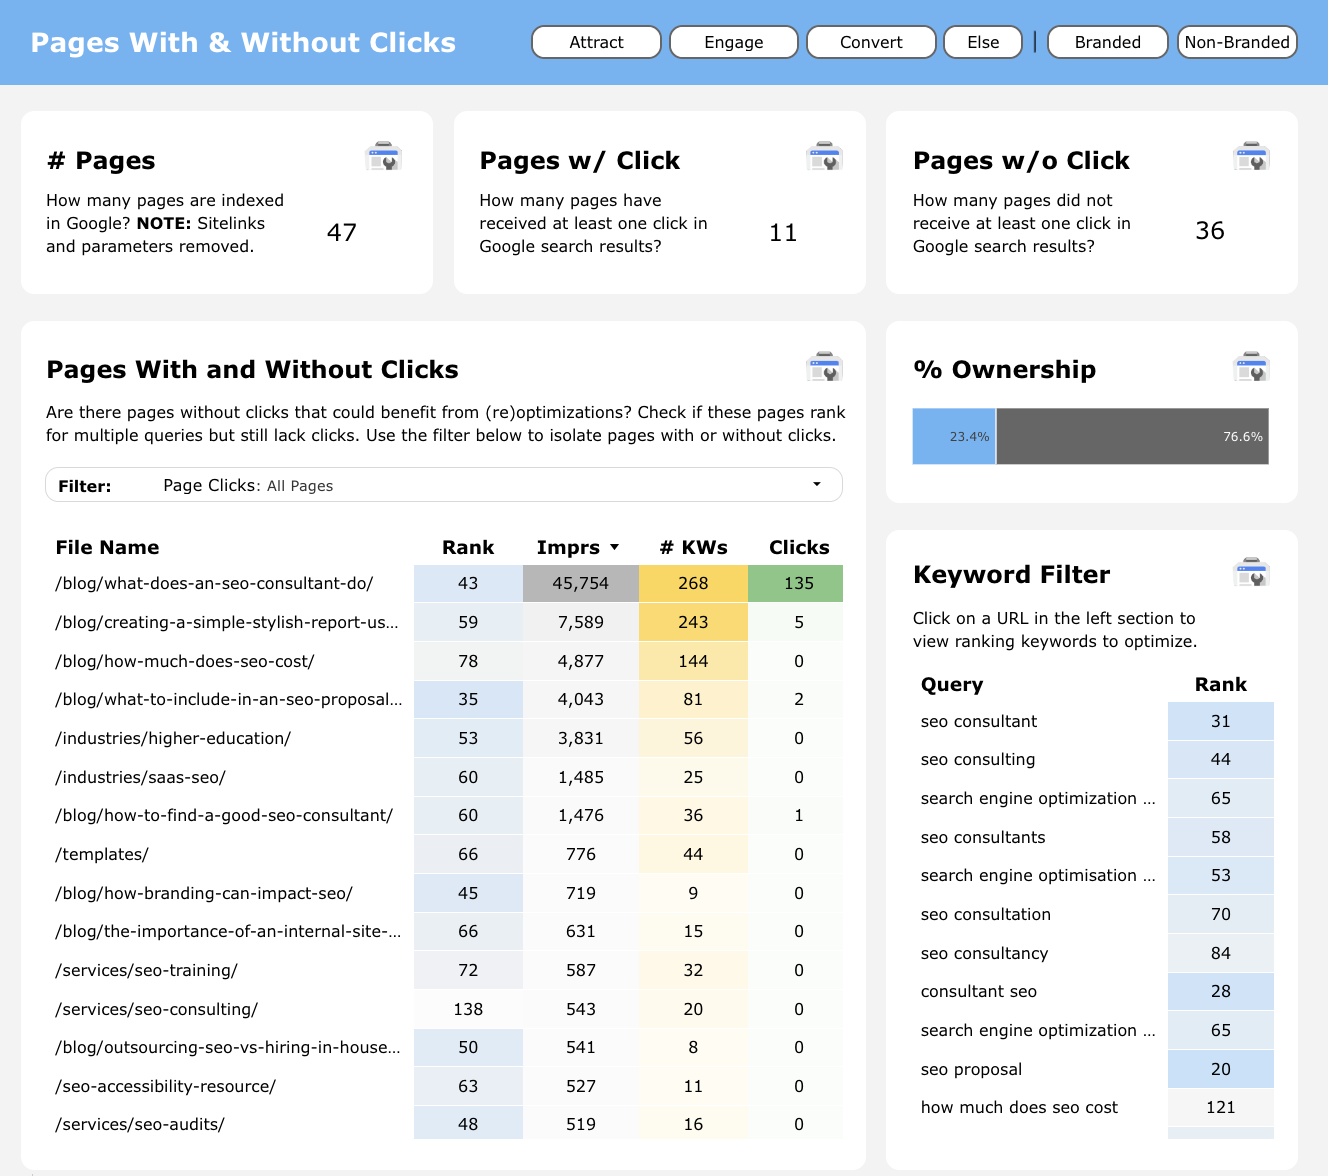
3. Pages With & Without Clicks
Identify pages that are receiving impressions but no clicks. This slide provides insights into which pages need optimization to improve their click-through rates and overall performance.
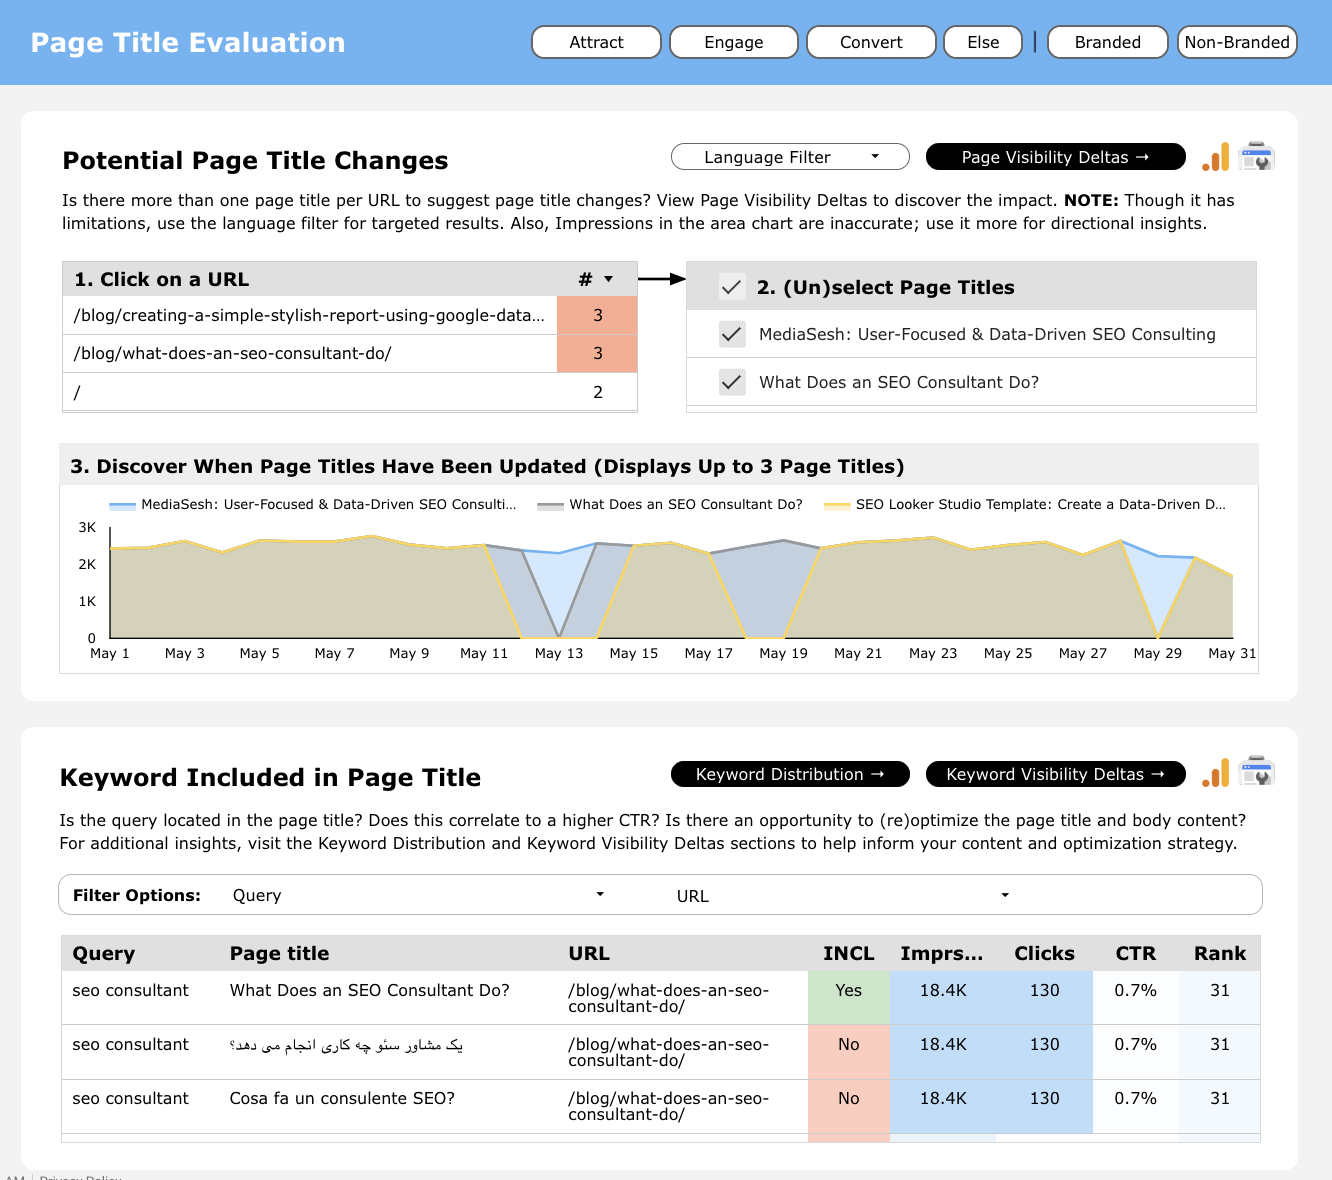
4. Page Title Evaluation
Evaluate the effectiveness of your page titles in driving traffic. This slide helps you discover when page titles have been updated and assess potential changes to optimize for better visibility and engagement.
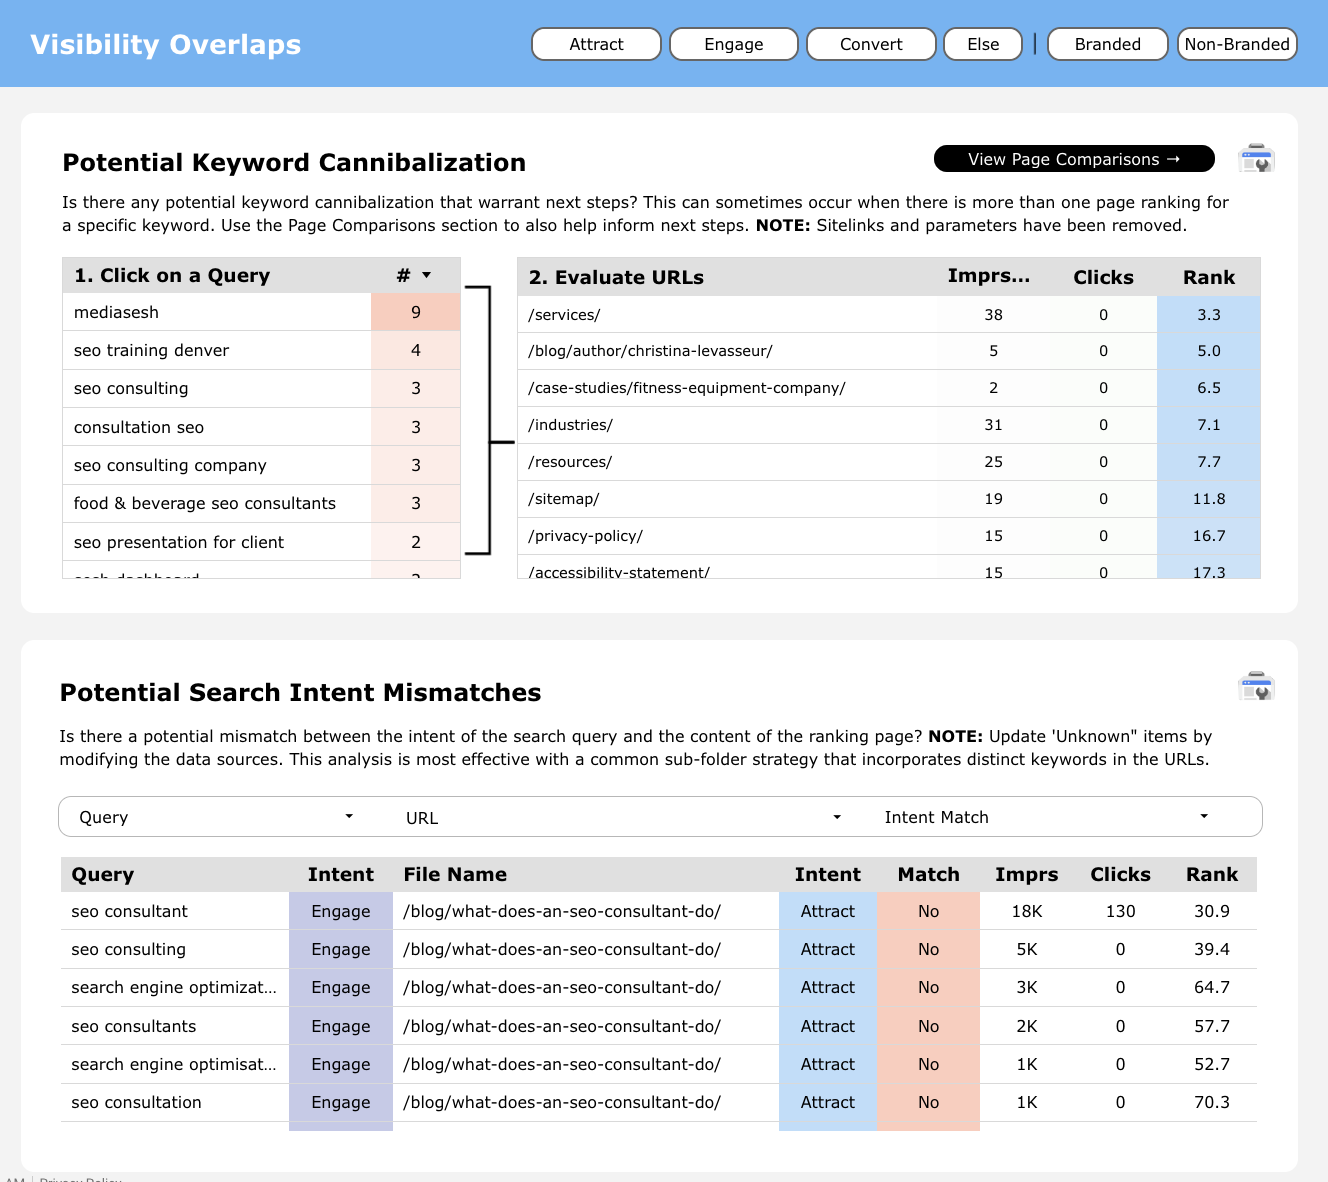
5. Visibility Overlaps
Detect potential keyword cannibalization and search intent mismatches. This slide helps you identify overlapping keywords and ensure your content aligns with user intent, improving overall search performance.
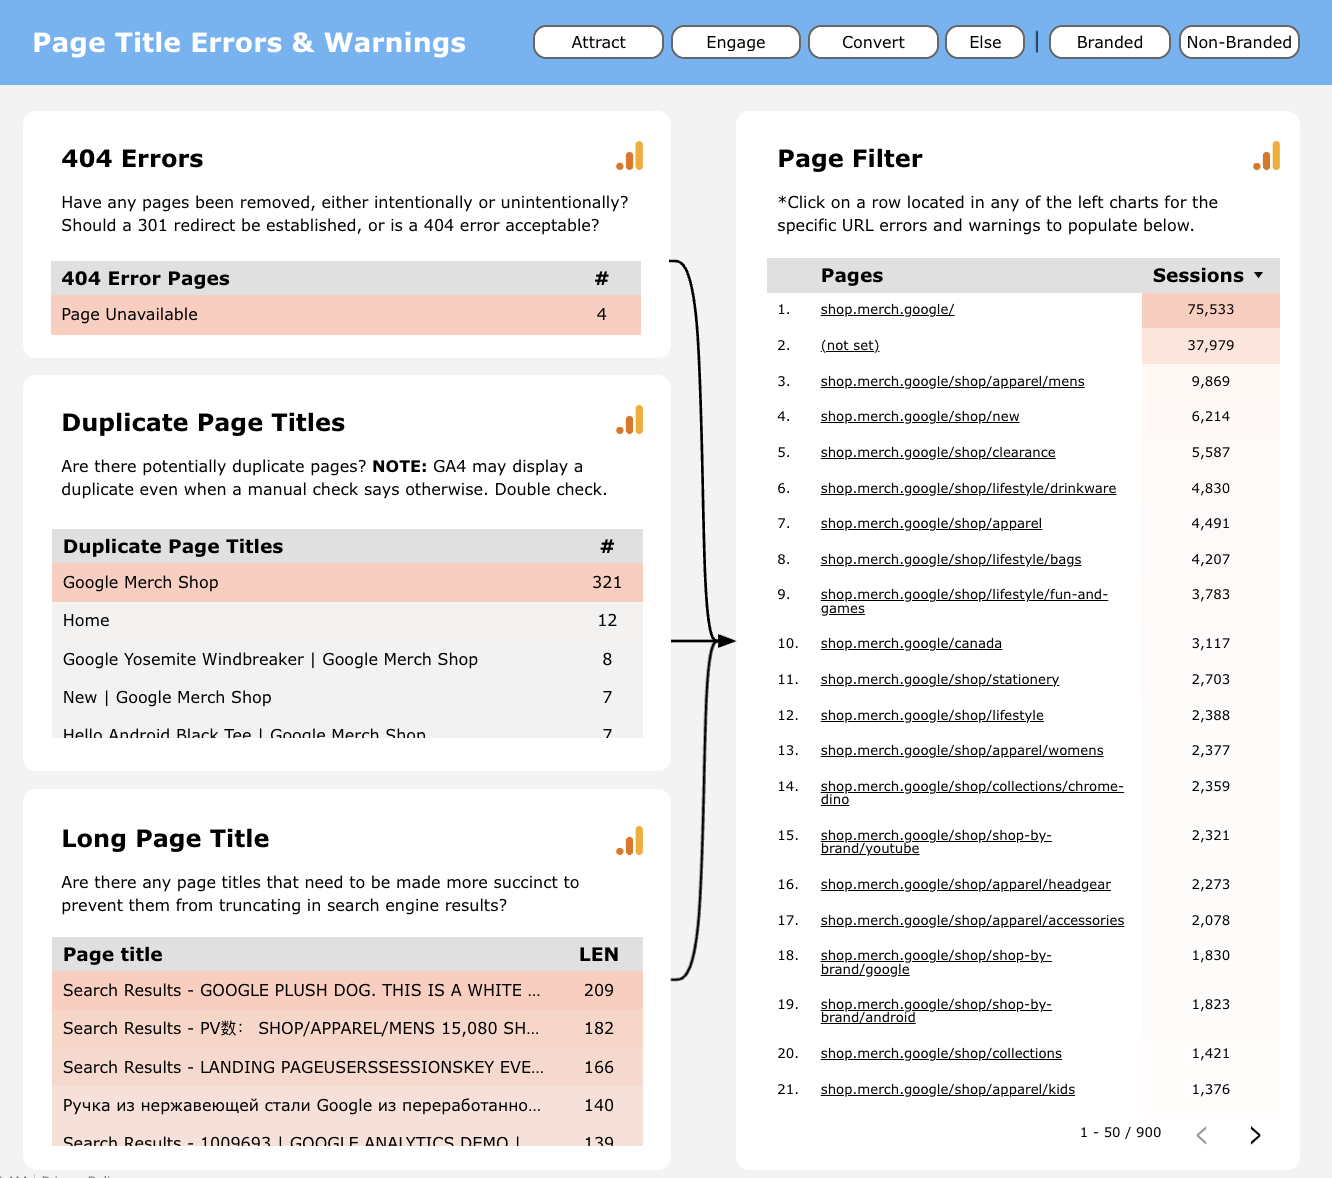
6. Page Title Errors & Warnings
Identify and resolve issues with your page titles. This slide highlights errors such as duplicate titles, long titles, and 404 errors, providing actionable insights to improve your SEO health.
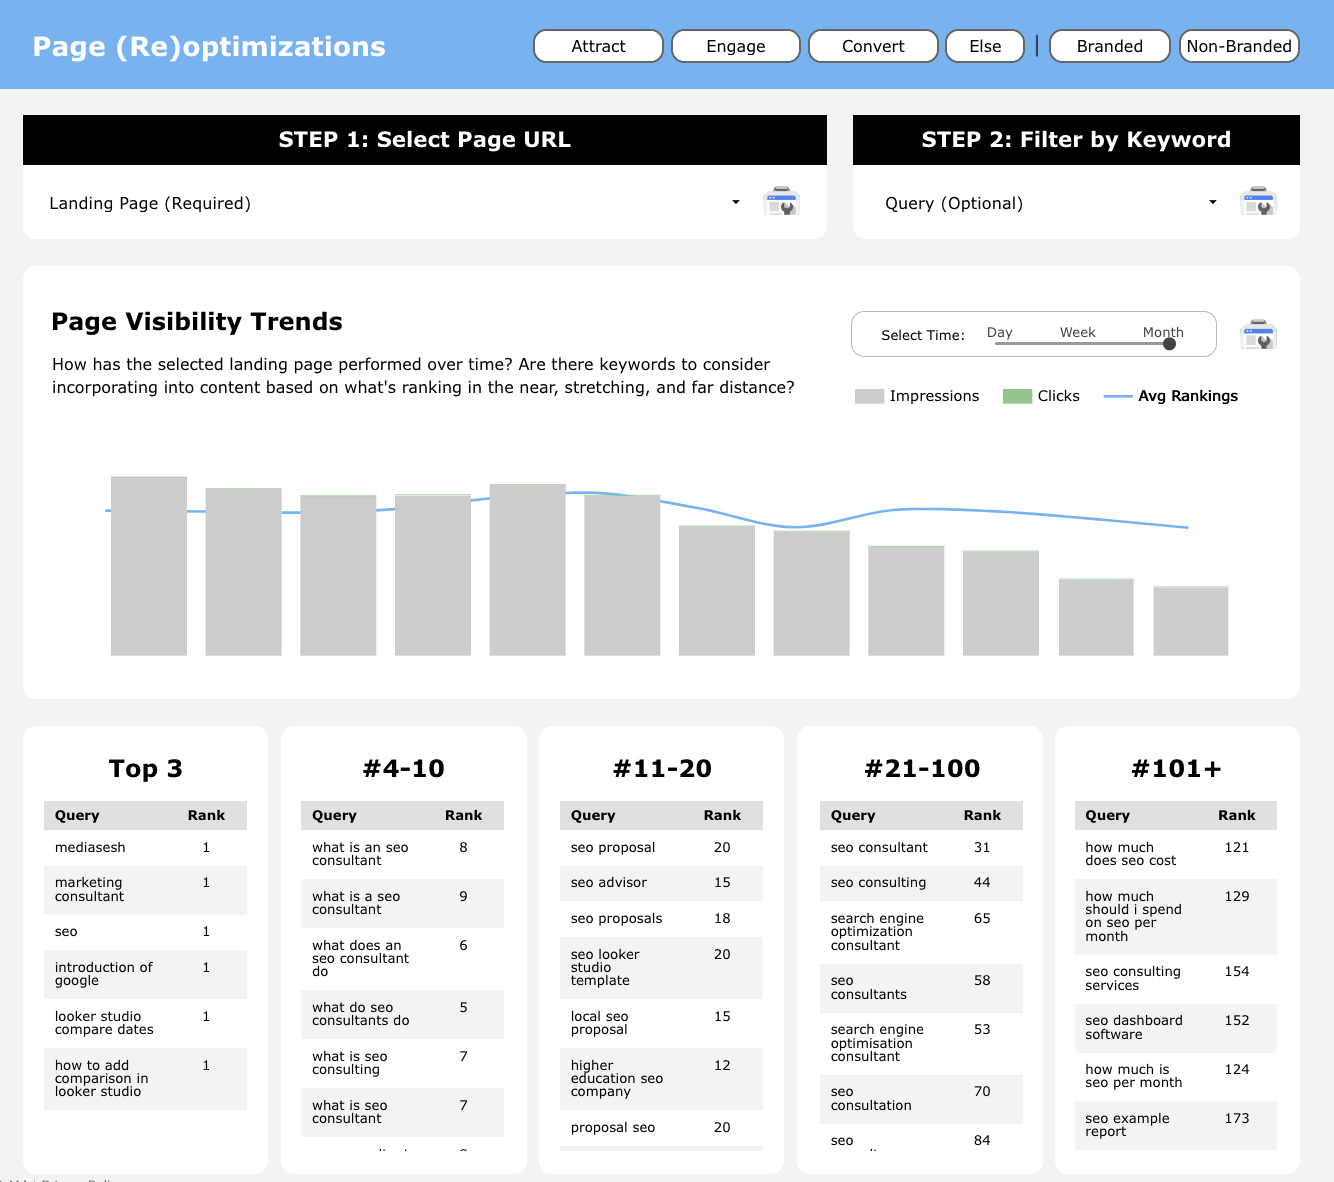
7. Page (Re)Optimizations
Focus on re-optimizing pages to enhance their performance. This slide tracks the visibility trends of selected landing pages and identifies top keywords to target for optimization.
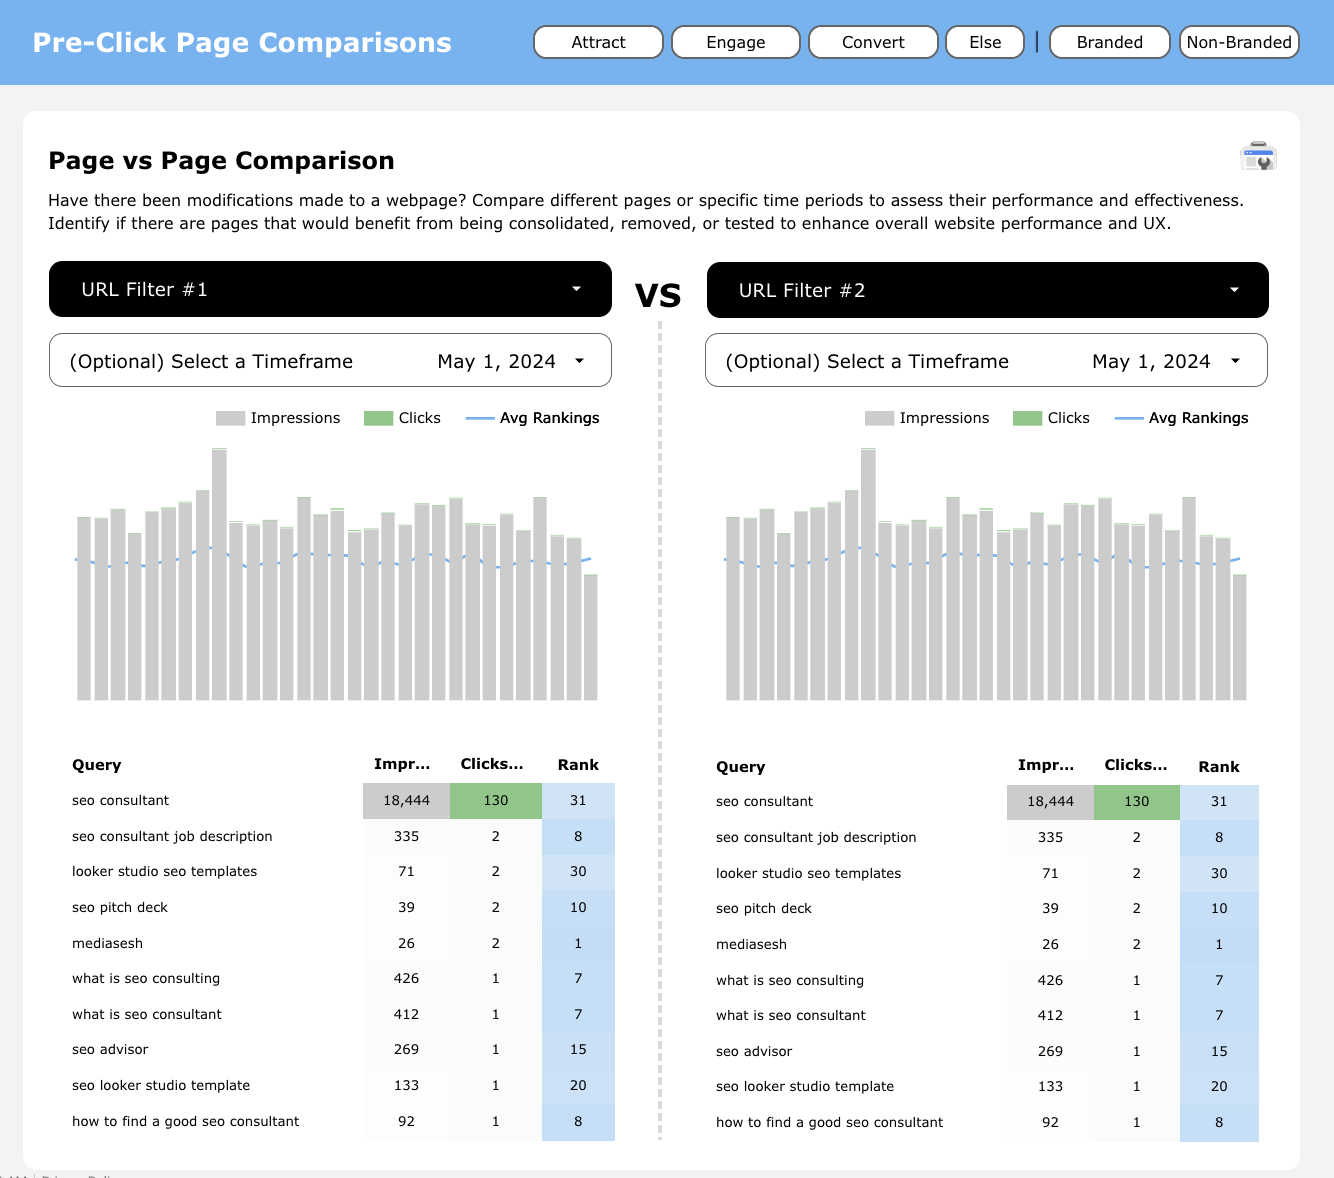
8. Pre-Click Page Comparisons
Compare the performance of different pages or time periods to evaluate success before users click through to your site. This slide provides a detailed analysis of impressions, clicks, and average rankings, helping you identify opportunities for improvement.
Attribution
The Attribution section provides a comprehensive analysis of how different marketing channels contribute to your overall traffic and conversions. This section includes the following detailed slides:
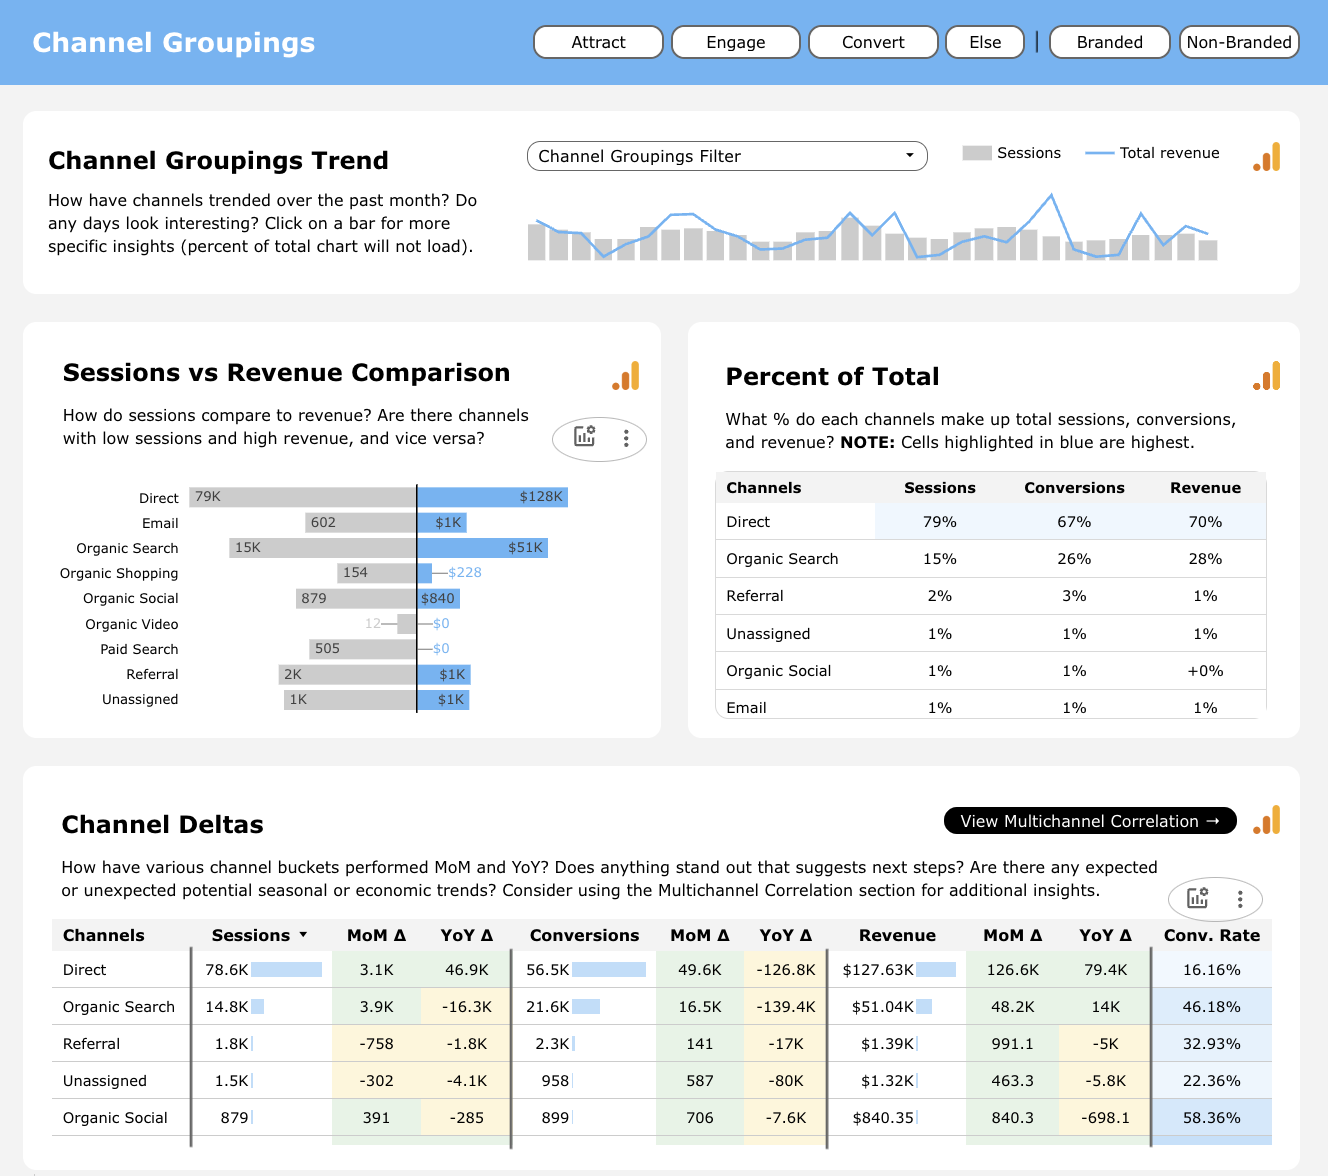
1. Channel Groupings
Understand the performance of various marketing channels with this slide. It shows trends in sessions, revenue, and other key metrics for each channel, helping you see which channels drive the most traffic and conversions.
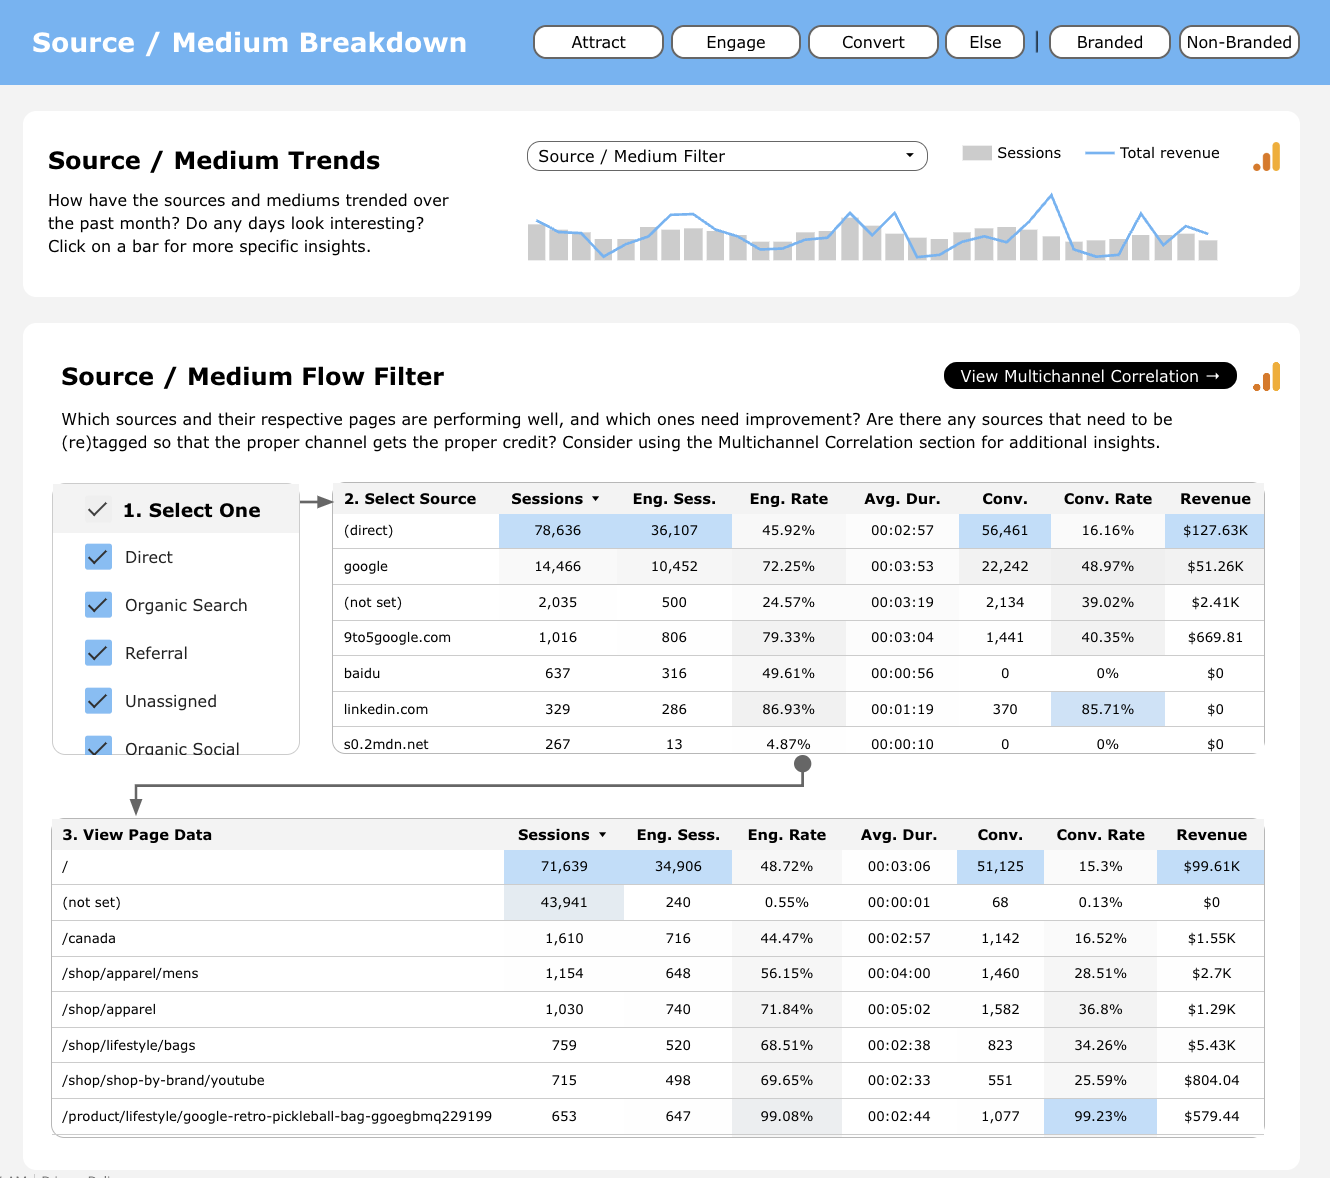
2. Source / Medium Breakdown
Dive deeper into the performance of specific sources and mediums. This slide provides a breakdown of sessions, conversions, and revenue by source/medium, enabling you to pinpoint the most effective traffic sources and optimize your marketing efforts.
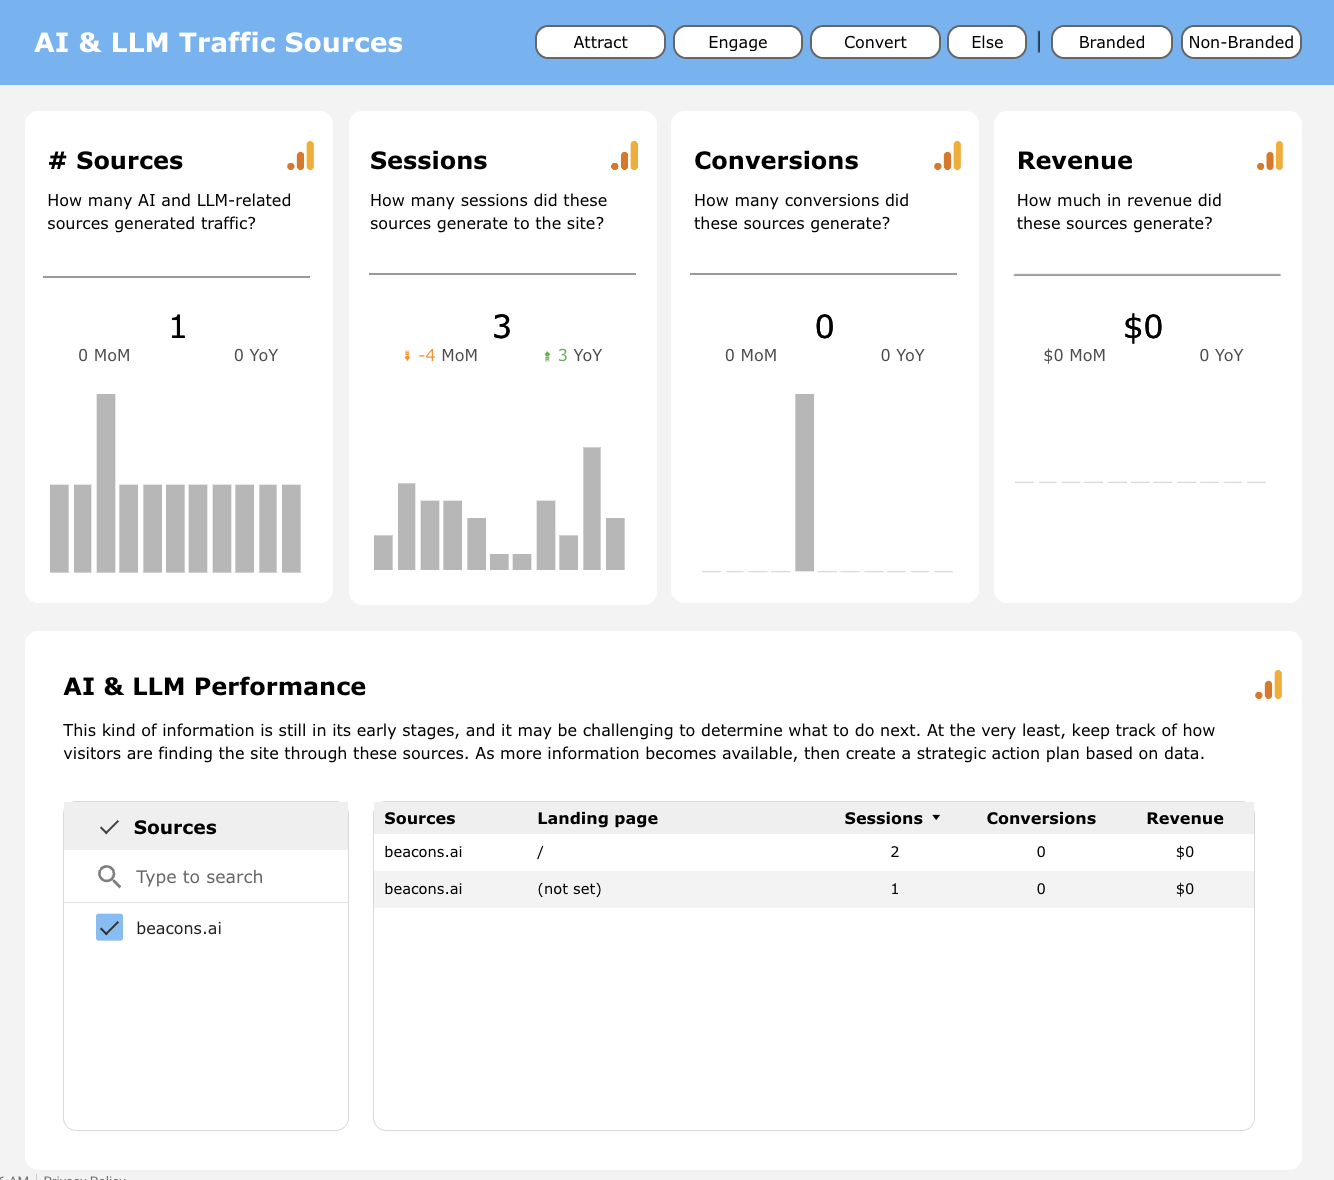
3. AI & LLM Sources
Track traffic and conversions from AI and large language model-related sources. This slide highlights the number of sessions, conversions, and revenue generated by these sources, giving you insights into the impact of AI-driven traffic on your overall performance.
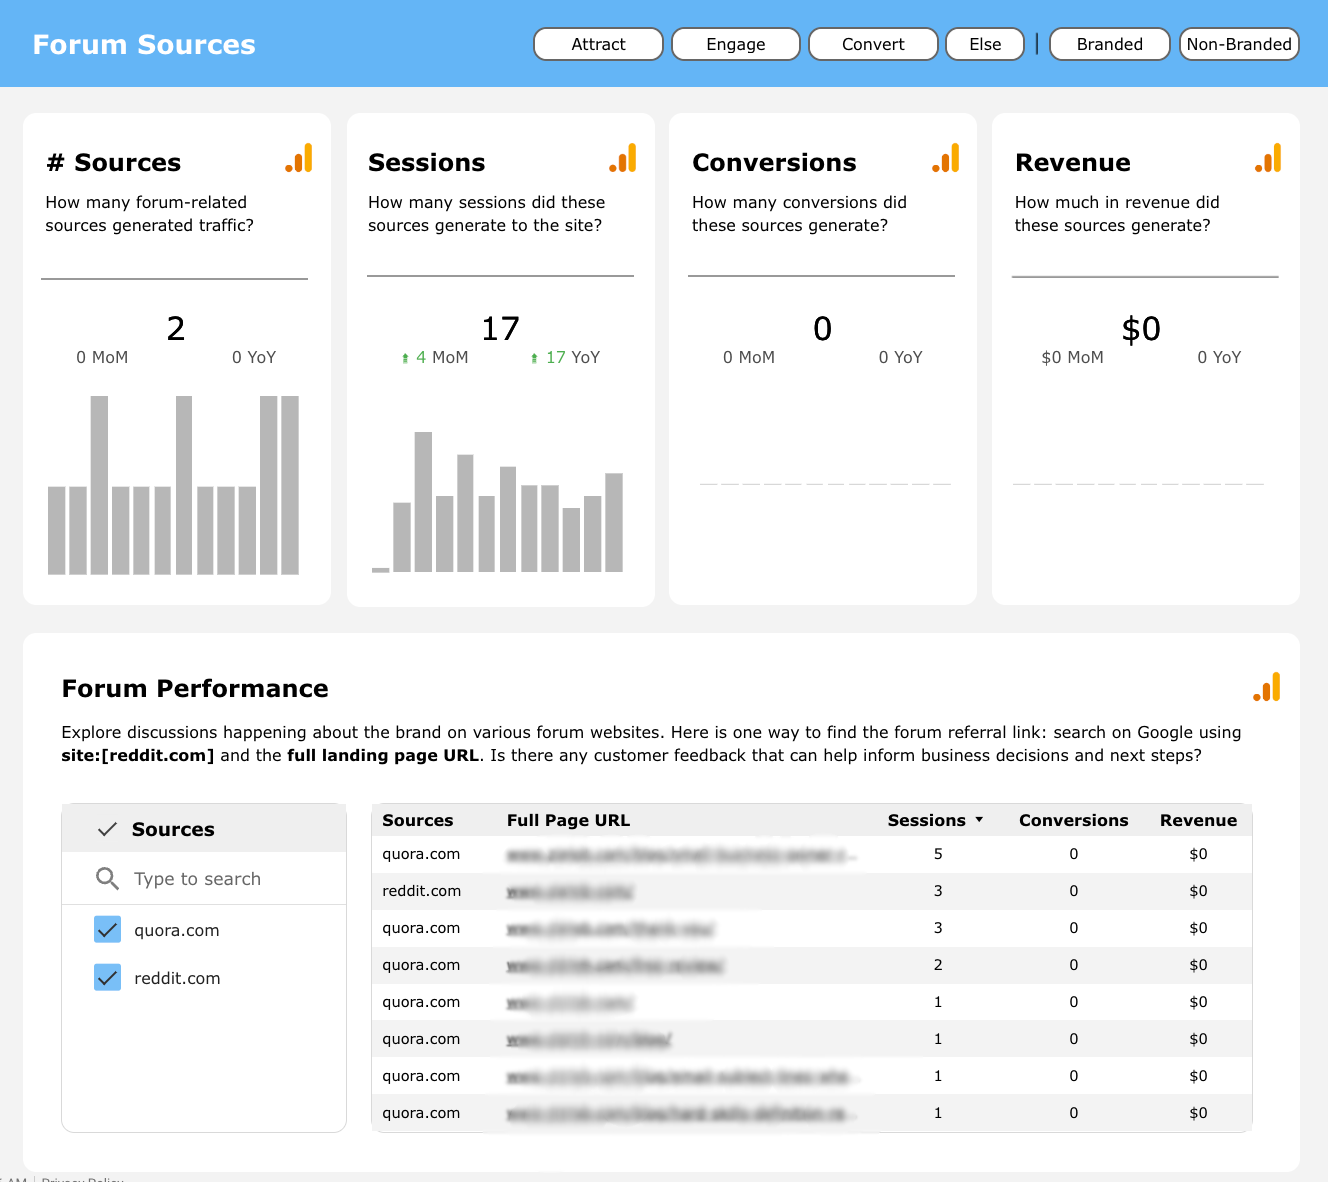
4. Forum Sources
Analyze the impact of traffic from forums. This slide shows the number of sessions, conversions, and revenue generated by forum sources, helping you understand the value of discussions about your brand on various forum websites.
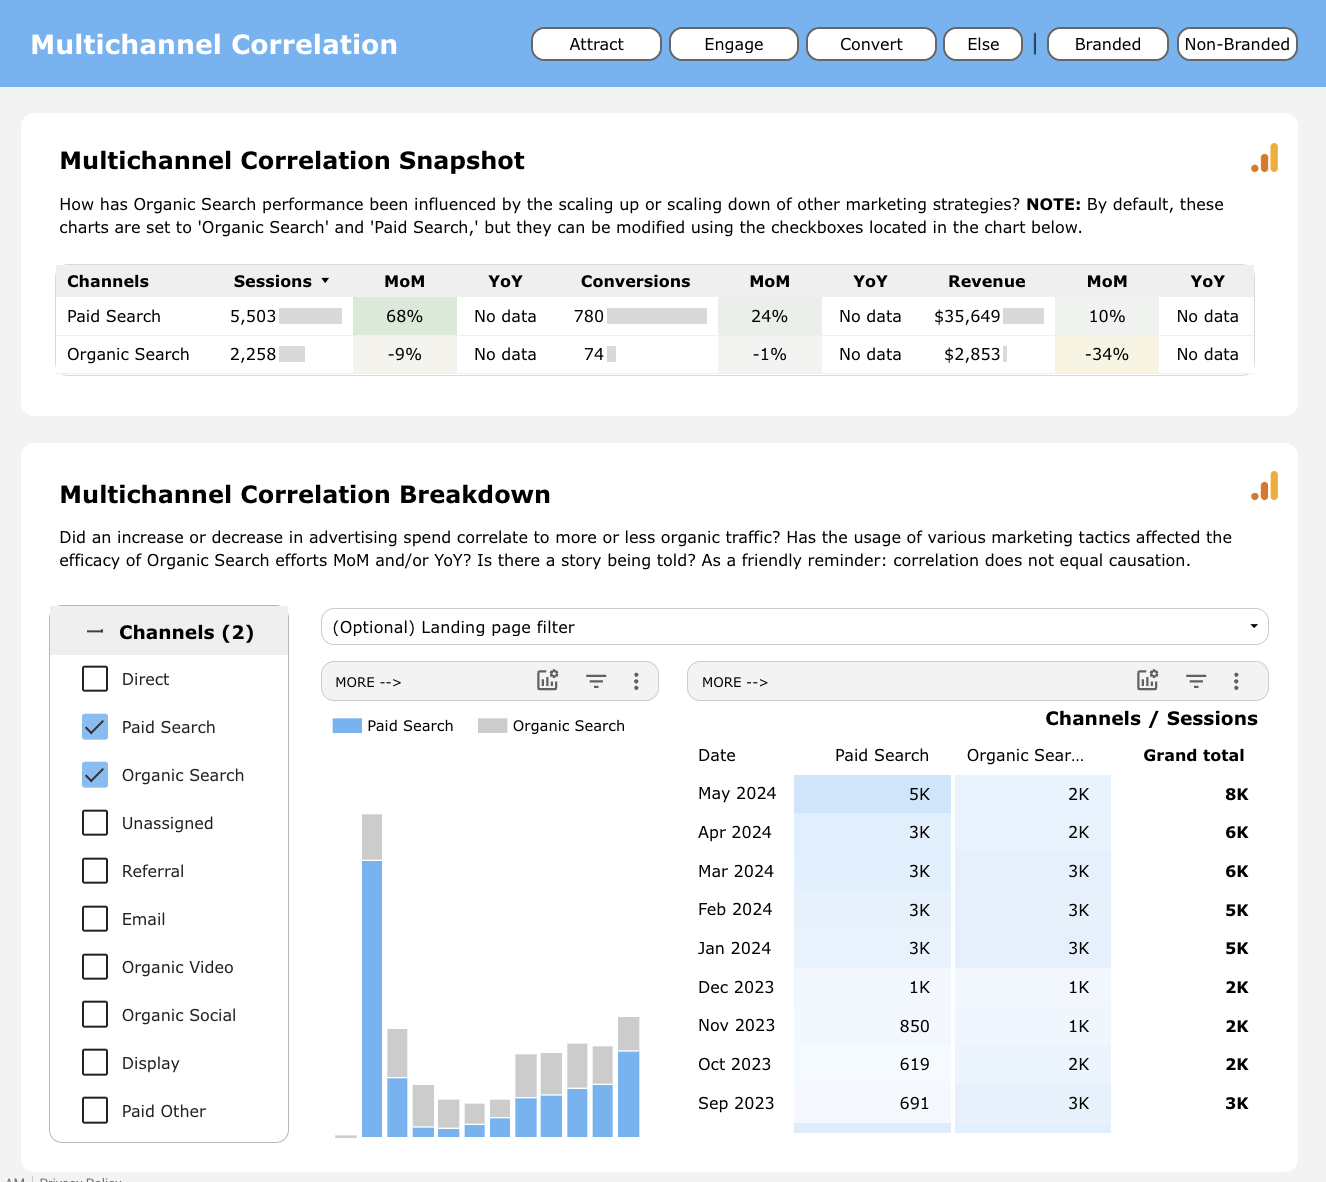
5. Multichannel Correlation
Explore the relationship between different marketing channels with this slide. It shows how organic search performance is potentially influenced by paid search and other channels, helping you understand the interplay between different marketing efforts and optimize your strategy accordingly.
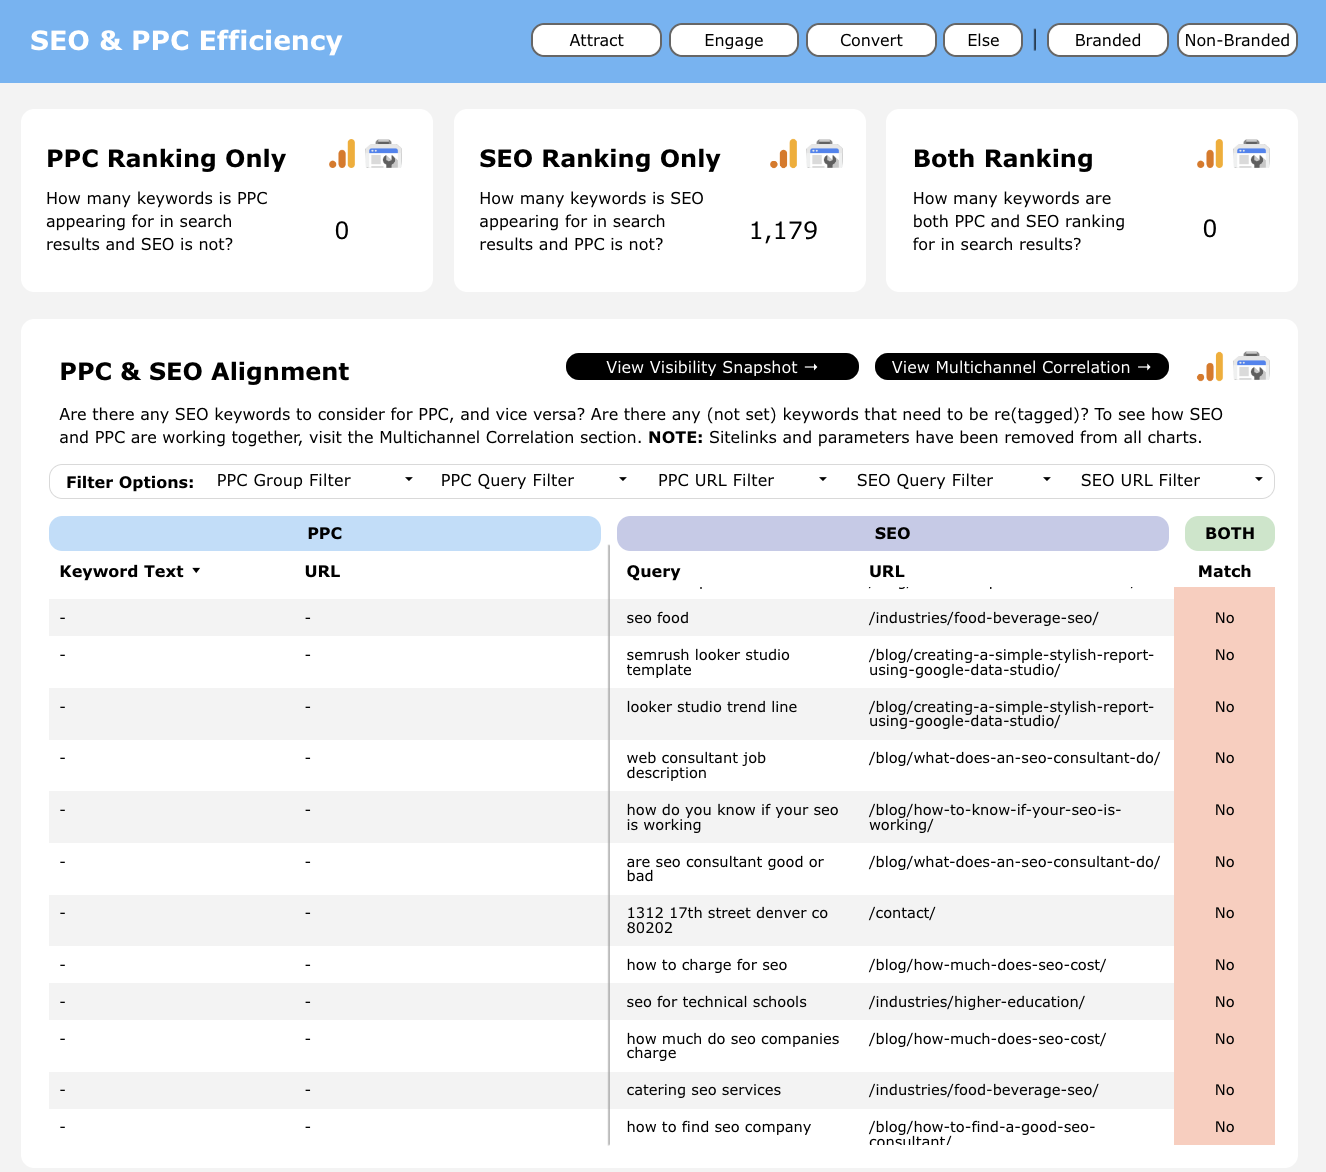
6. SEO & PPC Efficiency
Evaluate the efficiency of your SEO and PPC efforts. This slide highlights keywords and pages that rank in both SEO and PPC, showing where your efforts are aligned and identifying opportunities to optimize for better performance in both areas.
Audience
The Audience section provides detailed insights into the demographics and behaviors of your website visitors, helping you tailor your content and marketing strategies to better meet their needs. This section includes the following comprehensive slides:
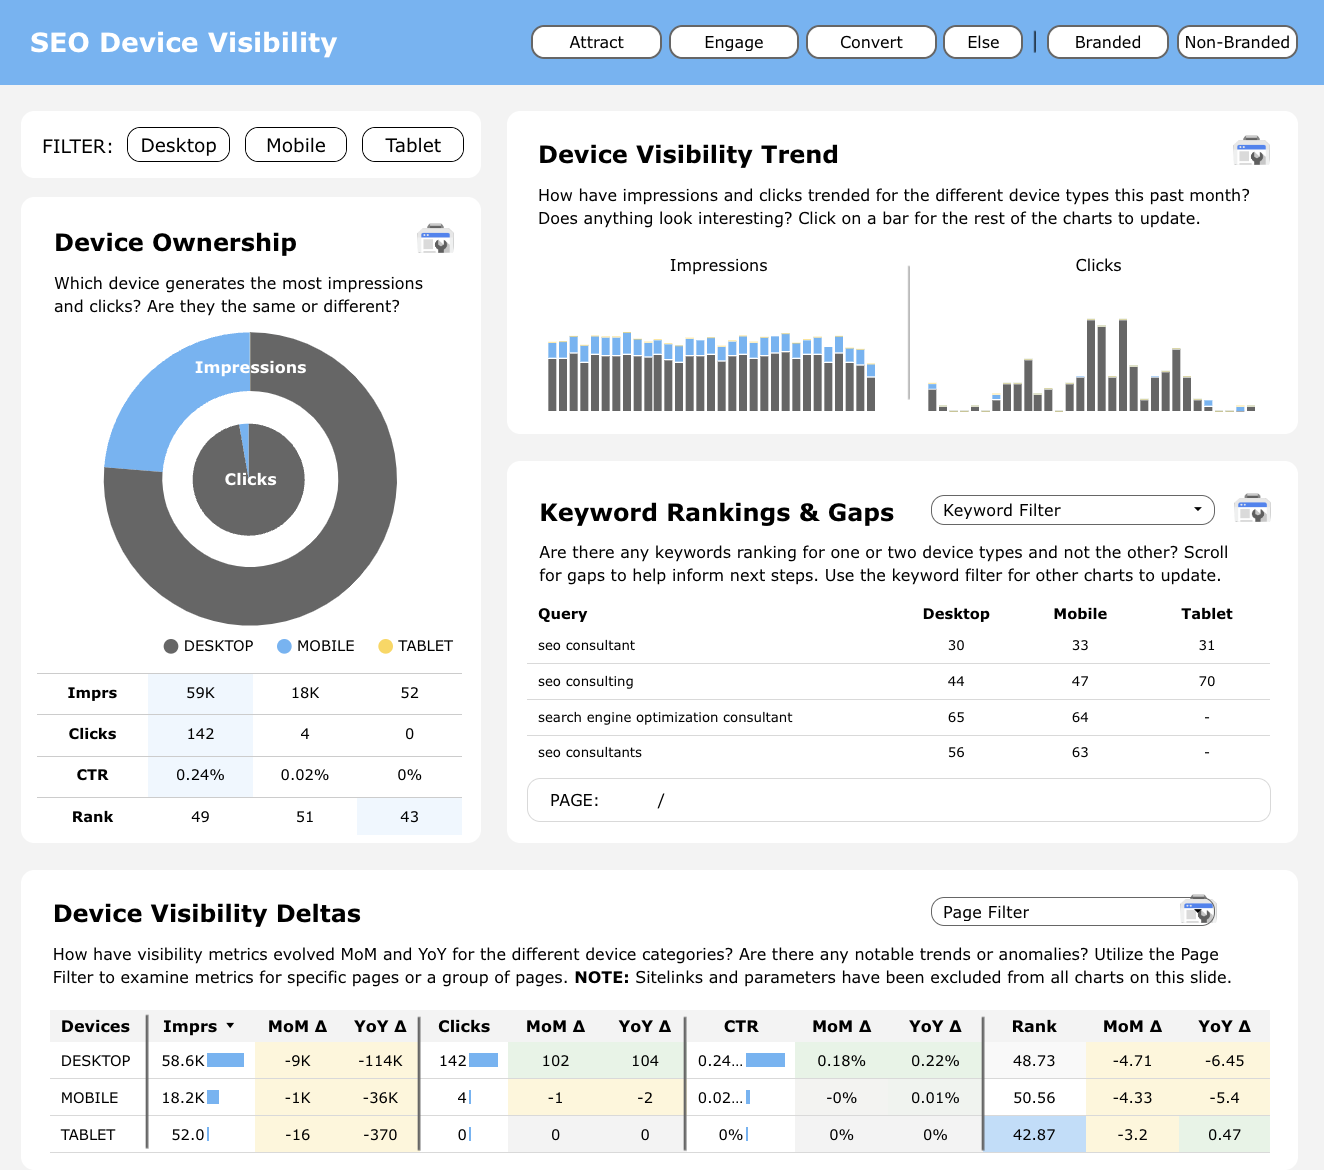
1. SEO Device Visibility
Understand how your content performs across different devices. This slide shows the distribution of impressions and clicks by device type (desktop, mobile, tablet), helping you identify which devices drive the most visibility and where there may be opportunities for improvement.
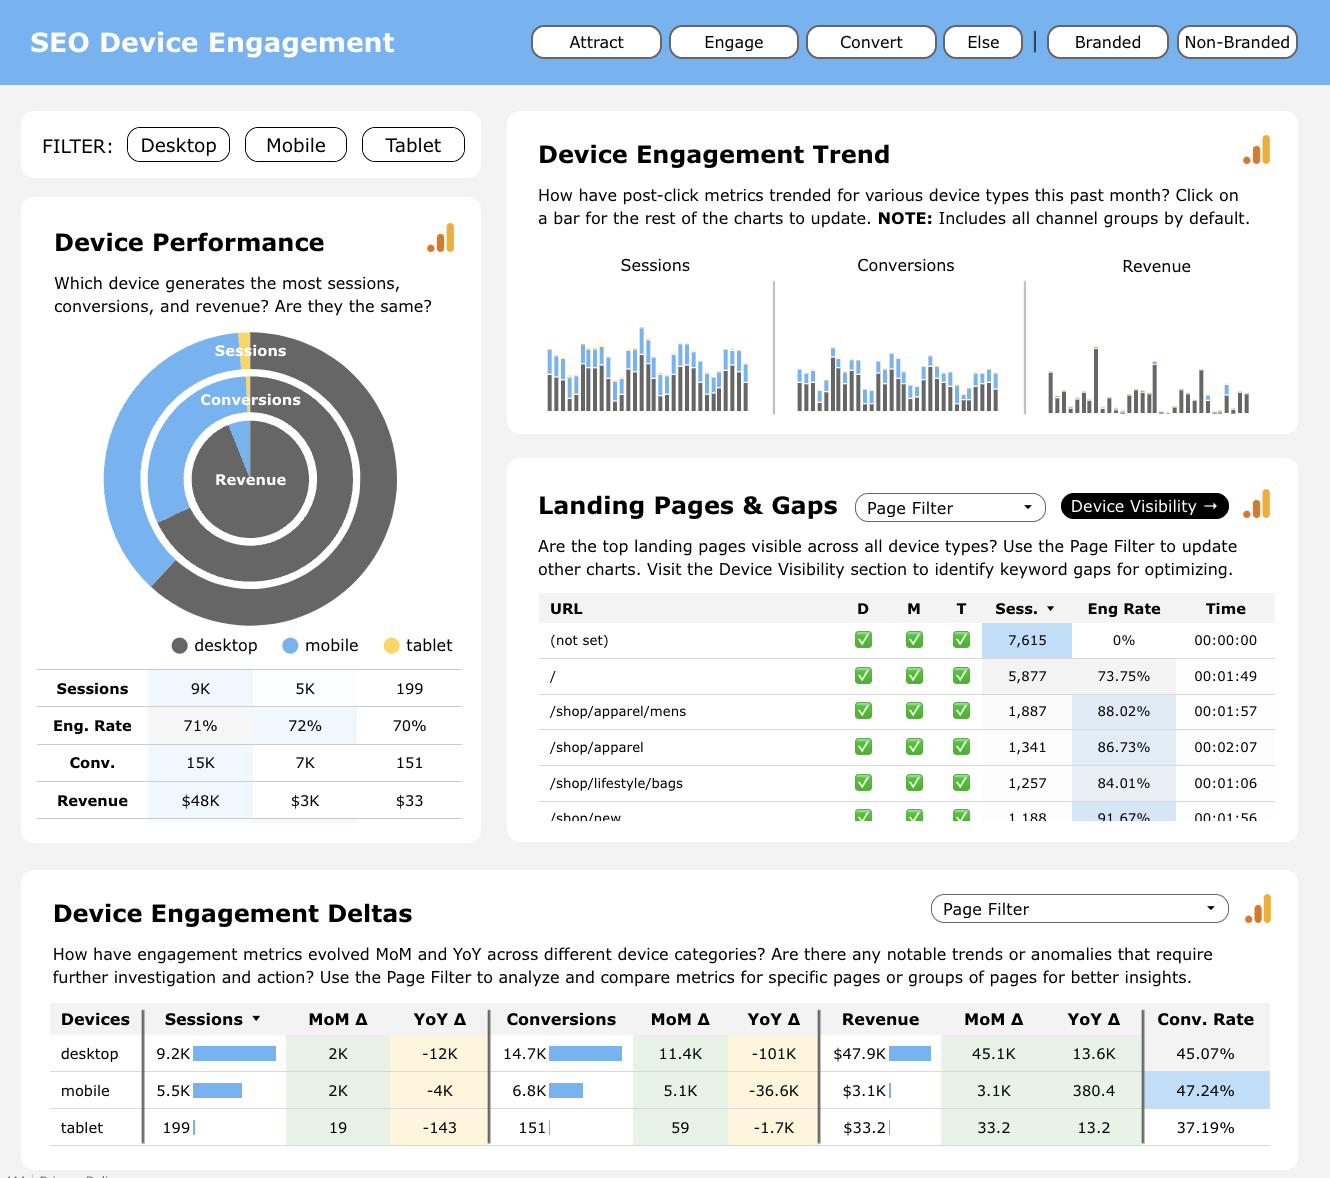
2. SEO Device Engagement
Analyze user engagement across various devices. This slide provides metrics on sessions, conversions, and revenue by device type, allowing you to see how users interact with your site on different devices and optimize for better engagement and conversions.
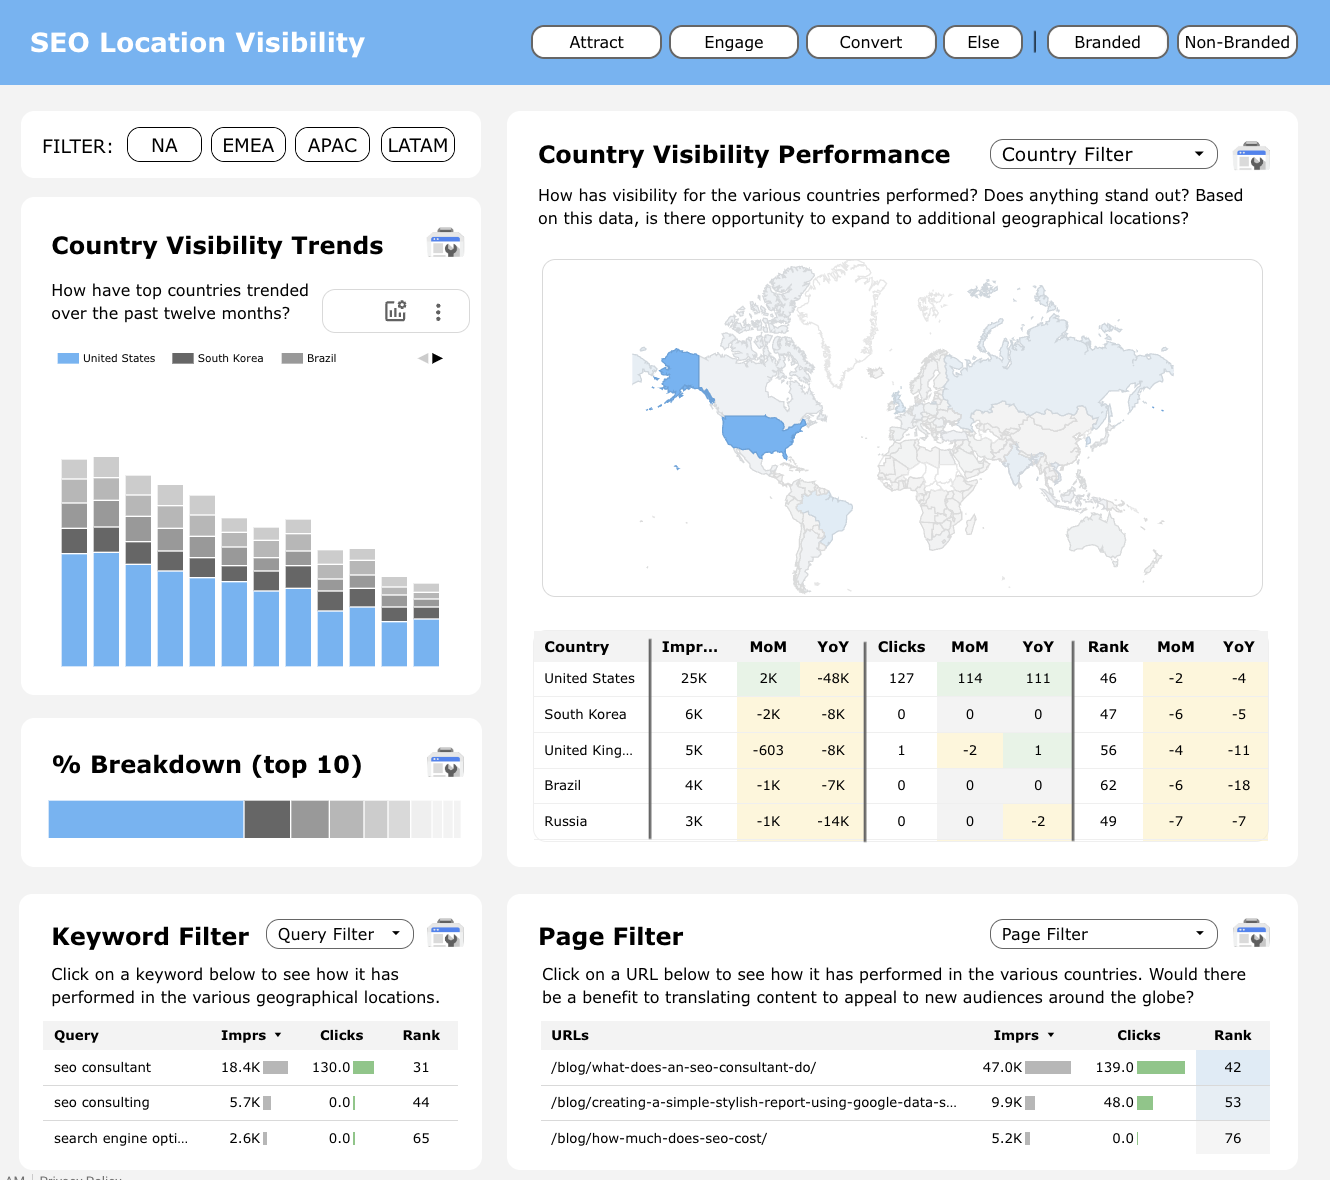
3. SEO Location Visibility
Gain insights into your website’s visibility across different geographical locations. This slide highlights impressions, clicks, and average rankings by country, helping you understand where your content is most visible and where there are opportunities to expand your reach.
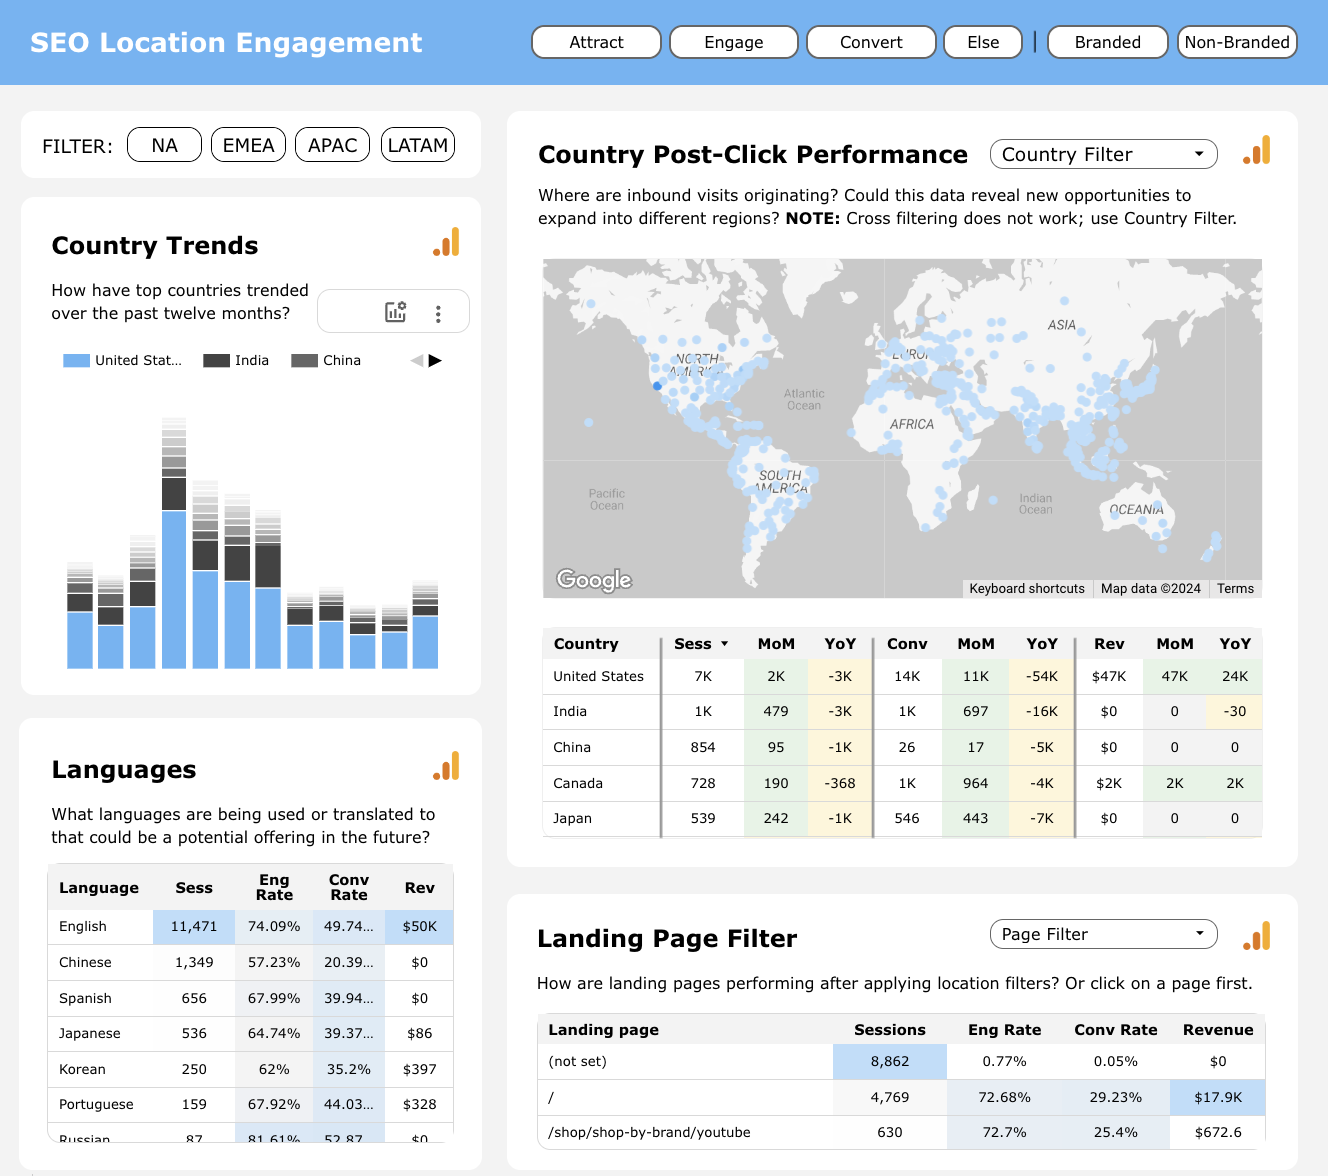
4. SEO Location Engagement
Evaluate user engagement from different locations. This slide provides data on sessions, conversions, and revenue by country, enabling you to tailor your content and marketing strategies to target specific regions more effectively.
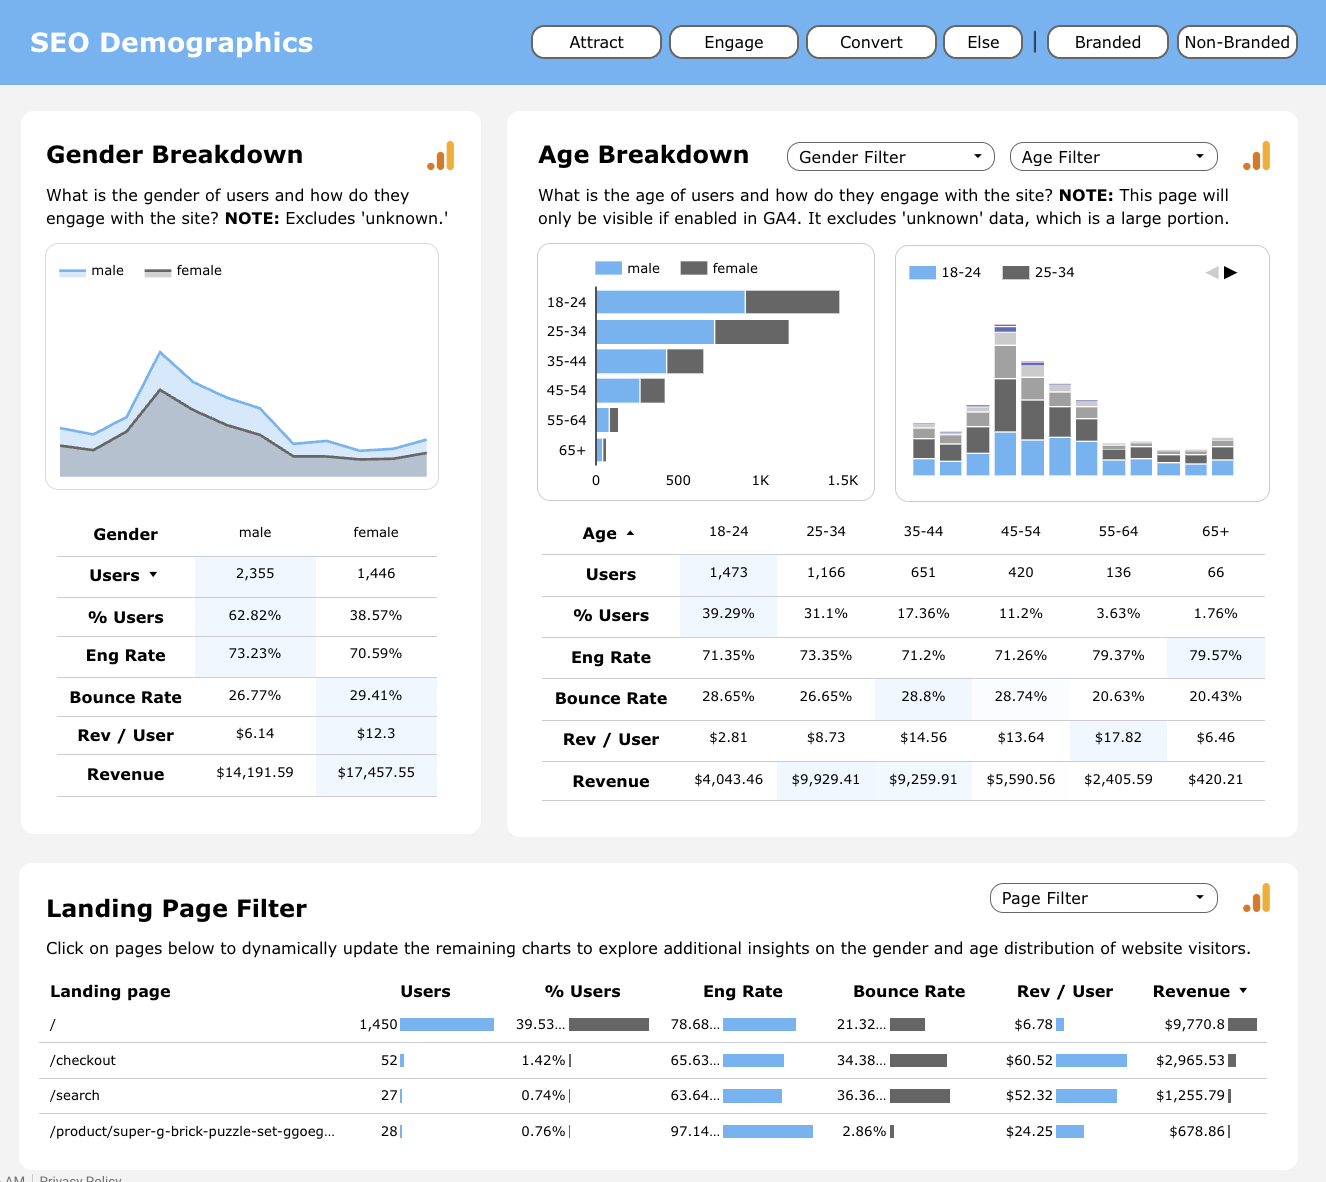
5. SEO Demographics
Get a detailed view of your audience’s demographics. This slide breaks down visitor data by gender, age, and other demographic factors, helping you understand who your audience is and how to better meet their needs with targeted content and marketing efforts.
Engagement
The Engagement section provides a comprehensive analysis of how users interact with your website, helping you understand their behavior and optimize your content for better performance. This section includes the following detailed slides:
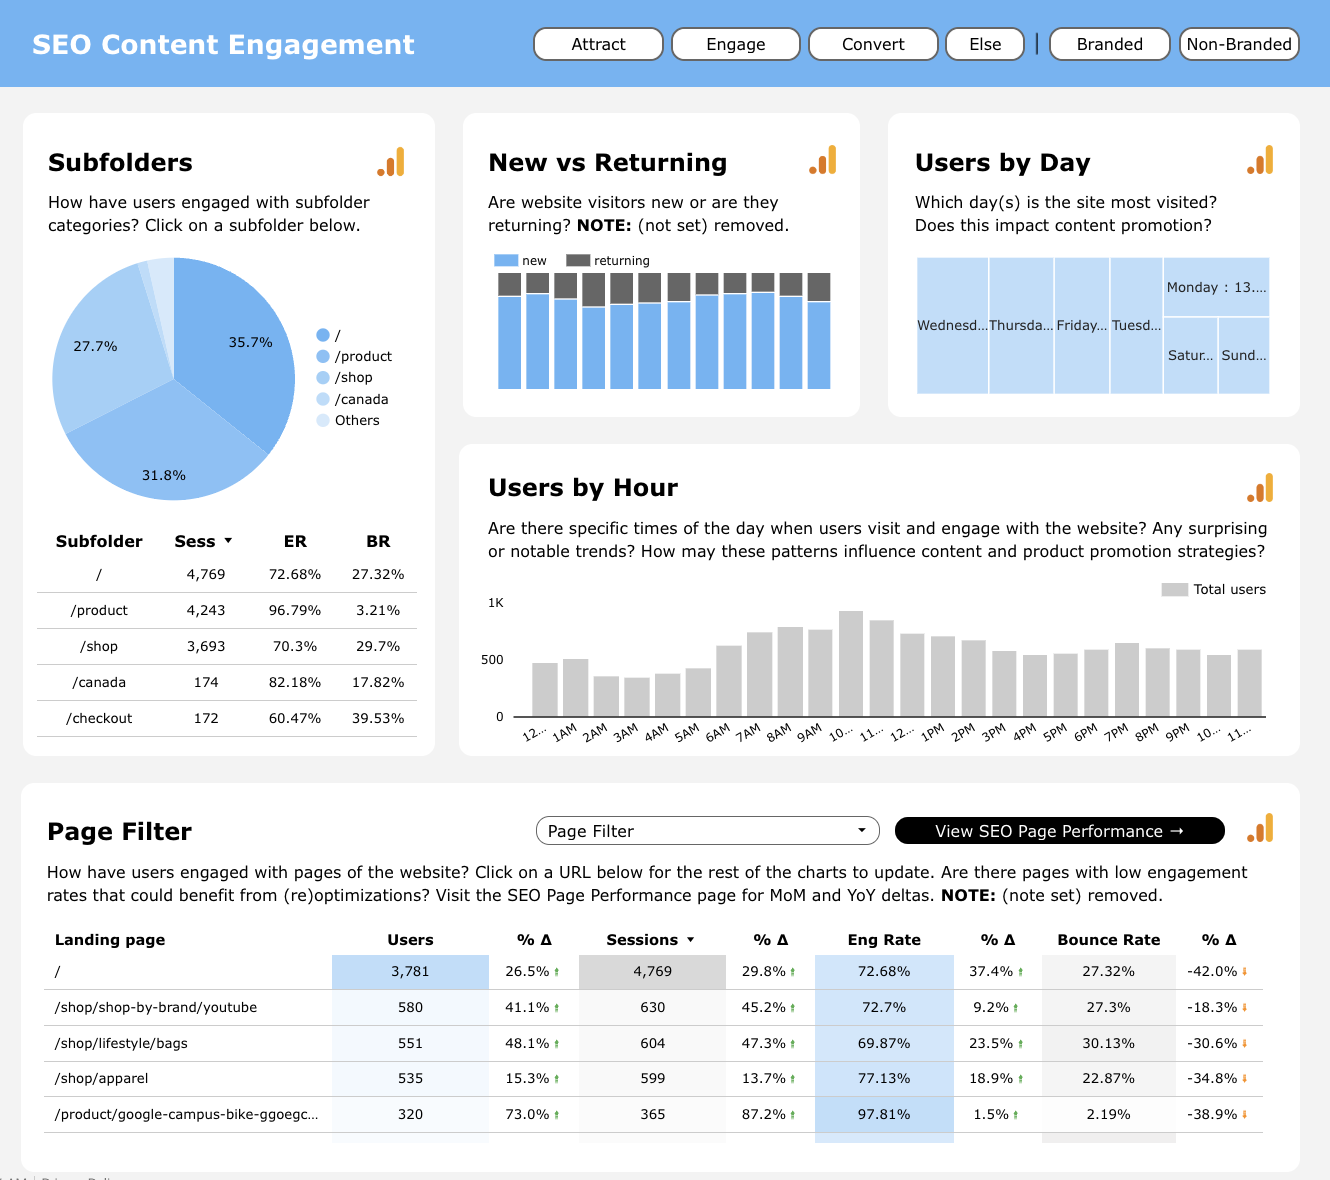
1. SEO Content Engagement
Evaluate user interactions with your content. This slide provides metrics on sessions, engagement rates, and bounce rates for different content categories. Understand which content pieces are most engaging and identify opportunities to enhance user experience and retention.
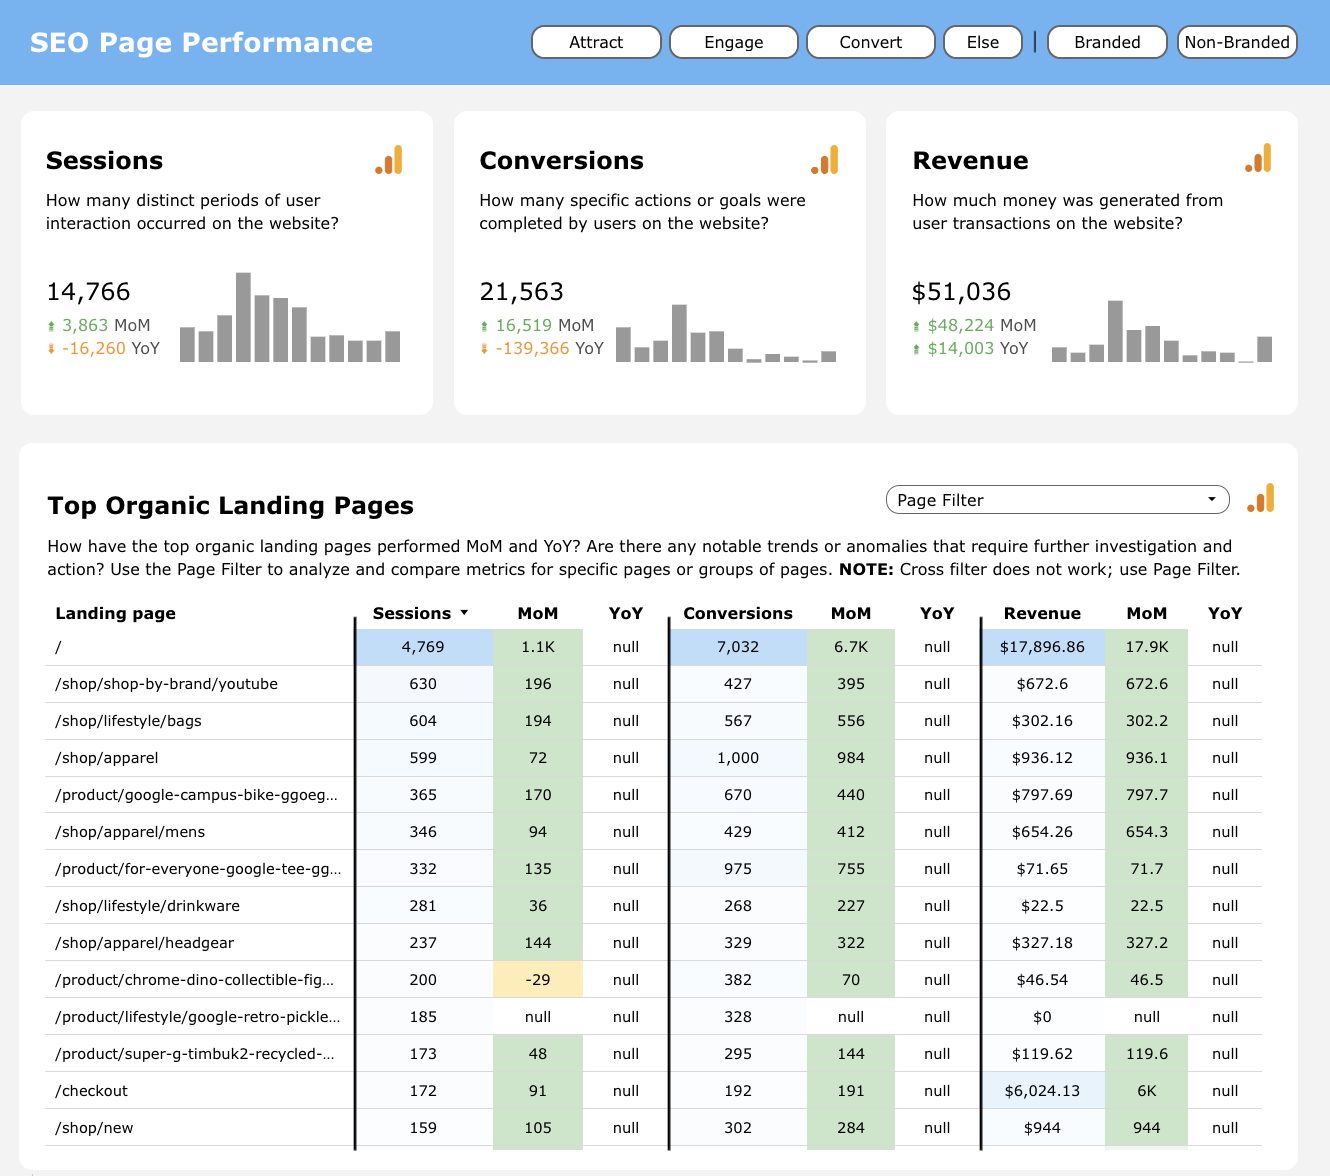
2. SEO Page Performance
Analyze the performance of individual pages. This slide shows key metrics such as sessions, conversions, and revenue for top landing pages, helping you identify which pages drive the most engagement and conversions and where there may be opportunities for optimization.
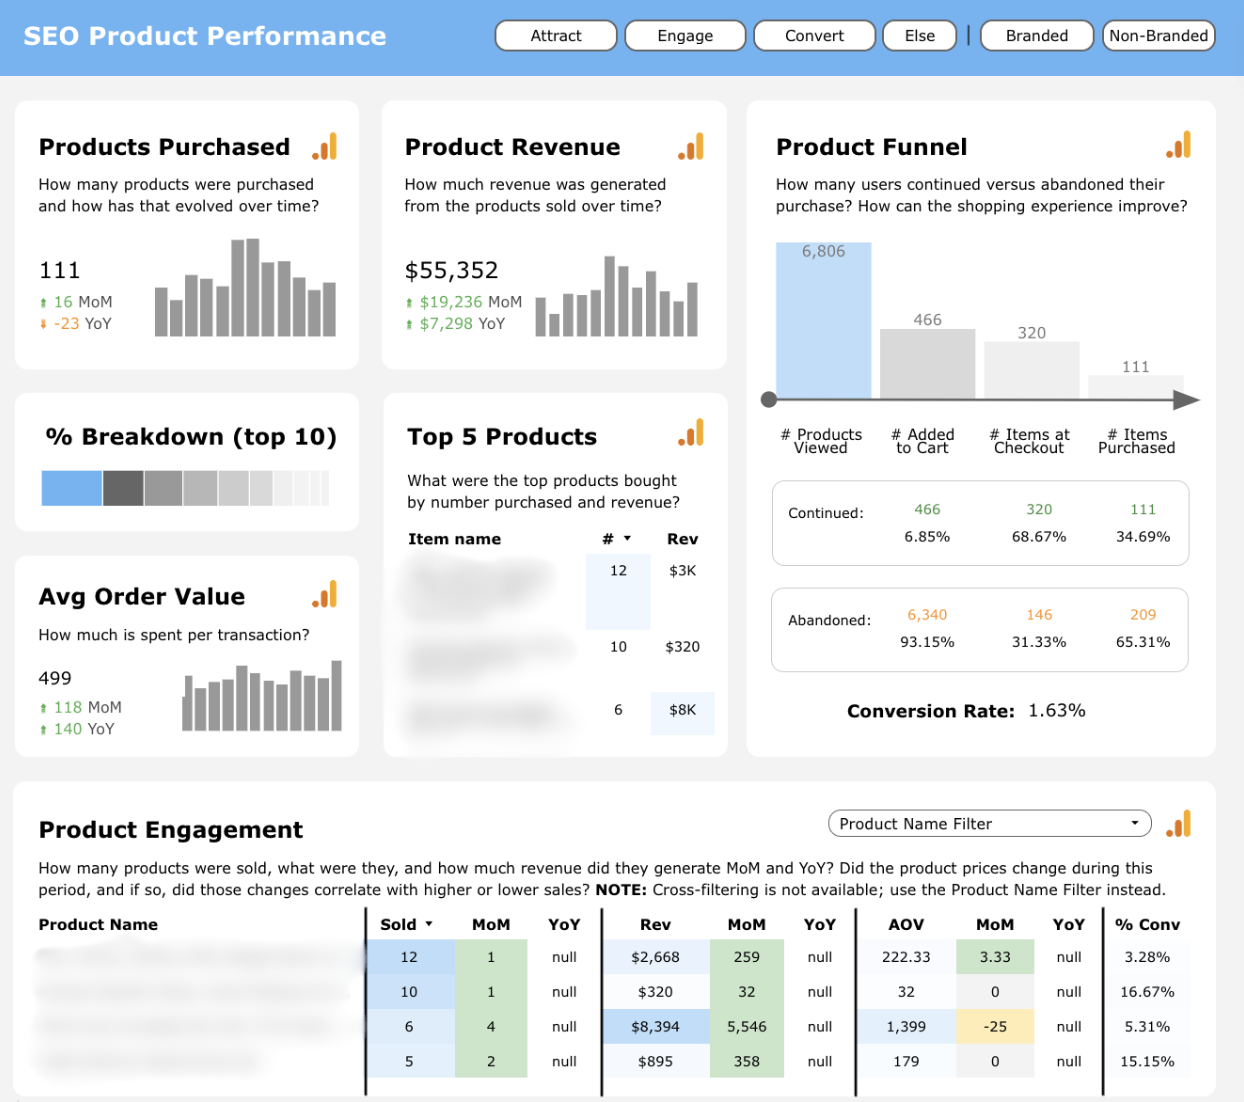
3. SEO Product Performance
Track the performance of your products. This slide provides insights into products purchased, product revenue, and conversion rates. Understand which products are most popular and identify opportunities to boost sales and revenue through targeted optimizations.
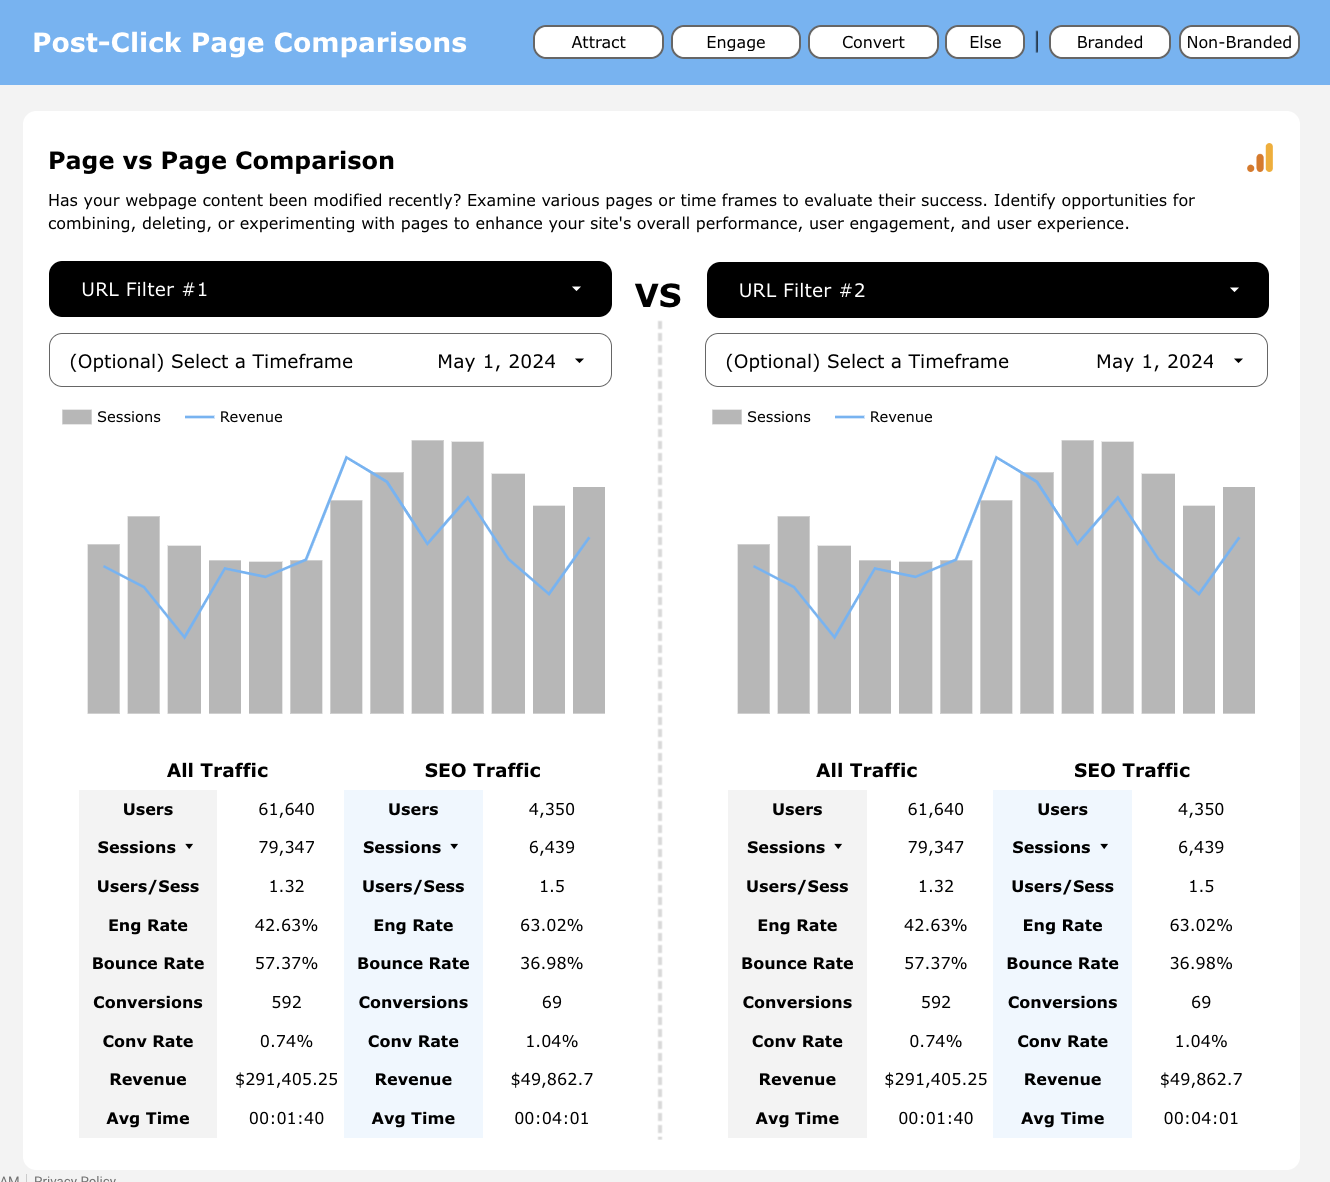
4. Post-Click Page Comparisons
Compare the performance of different pages after users click through from search results. This slide provides detailed metrics on user engagement, conversions, and revenue for selected pages, helping you identify which pages are most effective at driving post-click actions and where improvements can be made.