Home > Resources > Looker Studio Templates

Google Looker Studio Templates
& Other SEO Resources

A GA4 dashboard displaying acquisition metrics for default channel groups, including users, sessions, events, and key events. Visualizations include top channel group trends, source ownership, device usage, retention, and channel performance over time. A breakdown table lists landing pages by channel with user, session, and event data. Filters allow segmentation by channel, source, subfolder, page, device, and country.

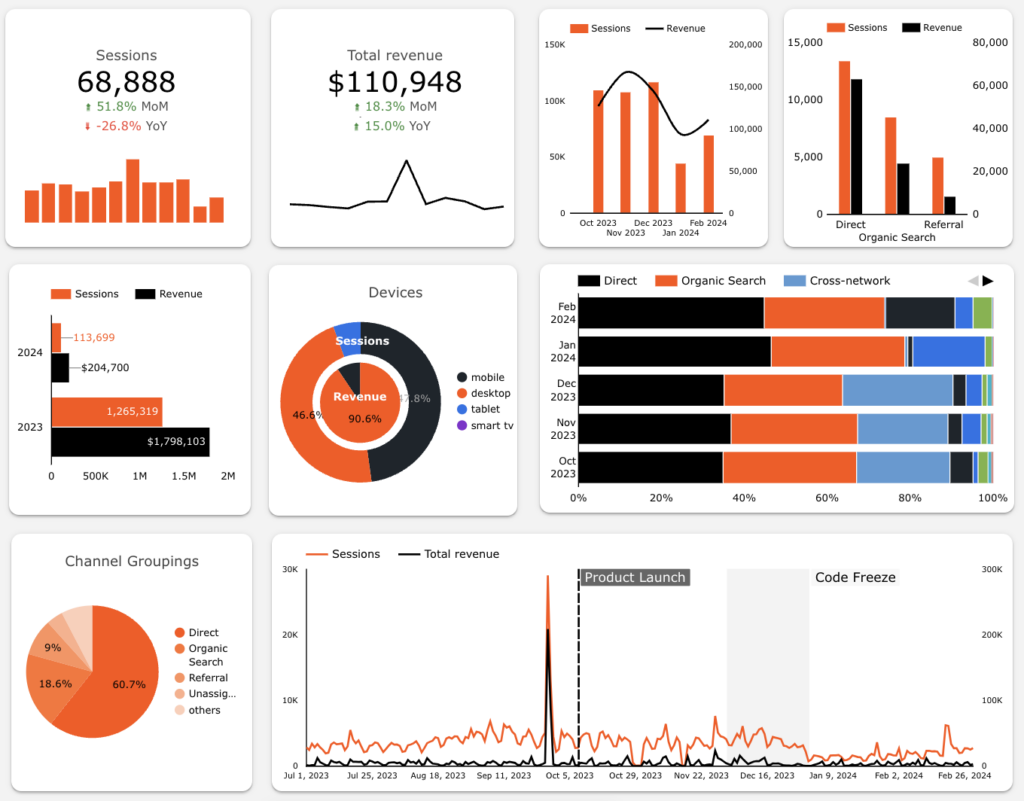
Google Analytics 4 (GA4) Marketing Report Looker Studio Dashboard

This GA4 Marketing Report Looker Studio Dashboard was designed to replicate the popular sections in GA4. It’s built for those who frequently add secondary dimensions, offering a streamlined way to view key insights. With a user-friendly interface, it helps you see what’s working, spot patterns, and dig deeper into the metrics that matter most. View marketing performance data in one place; analyze channel performance, audience demographics, user behavior, and conversion and product data, in just a few clicks.

A slide titled "SEO Device Engagement." This dashboard includes sections for Device Performance, Device Engagement Trend, Landing Pages & Gaps, and Device Engagement Deltas. Device Performance shows a pie chart comparing sessions, conversions, and revenue across desktop, mobile, and tablet devices. Device Engagement Trend graph displays trends for sessions, conversions, and revenue for various device types over the past month. Landing Pages & Gaps section lists top landing pages with visibility across all device types, showing engagement metrics. Device Engagement Deltas section shows month-over-month (MoM) and year-over-year (YoY) changes in sessions, conversions, revenue, and conversion rate for each device type, with filter options for pages.

SEO Customer Journey Looker Studio Template

36 pages of data! Elevate your SEO strategy and visualize your data in new and informative ways with this Looker Studio template. Utilizing GA4 and GSC data sources, it’s been crafted to provide a comprehensive and high-level view of the entire customer journey, helping you gain actionable insights for more informed decision making. Ideal for digital marketers, SEO professionals, and business owners, this powerful tool tracks key metrics across the user journey, such as visibility, attribution, audience, and engagement.

A dashboard screenshot from Looker Studio, a data visualization tool. The dashboard includes various sections: '# Ranking Keywords' with a bar graph showing a total of 1,355 keywords and performance metrics; 'Keyword Distribution' showing the number of keywords ranking at positions #1-10, #11-20, and #21+ with changes over time; 'Keyword Performance' with a scatter plot mapping average position against impressions; and tables listing queries ranked at '#1-10', '#11-20', and '#21+' along with their ranks. Another table on the right lists 'Ranking URLs' with corresponding impressions and clicks. The interface has navigation tabs such as 'Intro', 'Overview', 'Pages', 'Keywords', 'Devices', 'Countries', and 'Types' across the top, with an option to 'Purchase' and settings for date range, landing page, query, search type, device, and country.

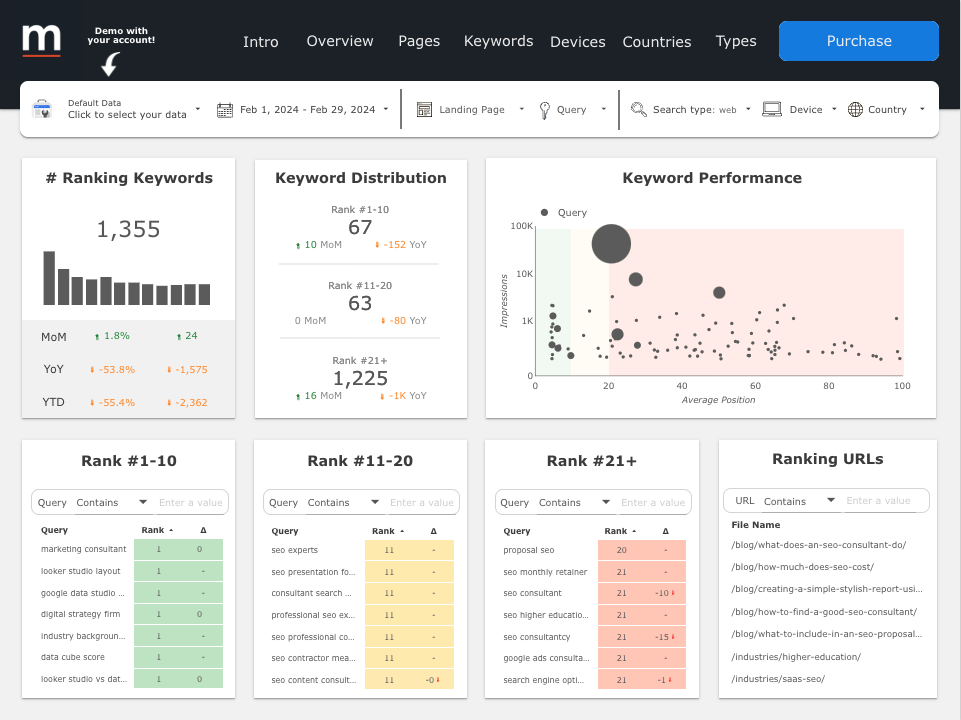
Google Search Console (GSC) Looker Studio Template on Page & Keyword Analysis

Elevate your data analysis with advanced insights. Specifically designed for deep analysis of page-level and keyword-level data from Google Search Console, this Looker Studio template is your go-to resource for extracting actionable insights from your search data, enabling strategic decisions that drive your website’s performance.

The image is a business metrics dashboard arranged in three rows. At the top, there are three charts: sessions count with monthly and yearly changes, total revenue with similar trends, and a bar chart comparing session sources. The middle row features a year-over-year bar chart for sessions and revenue, a pie chart showing device-based session and revenue distribution, and a stacked bar chart of monthly traffic sources. The bottom row includes a pie chart detailing traffic channel groupings and a line graph correlating sessions and revenue with key events over time.

GA4 Looker Studio Data Visualization Charts

Create impactful reports with this Google Looker Studio template. Designed for data analysts, website managers, and digital marketing professionals, this template provides a diverse array of data visualization charts to derive insights, giving you the flexibility to create tailored, interactive reports that speak to your audience’s needs.

Overall traffic summary slide in Google LookerStudio. It contains month over month and year over year deltas for sessions, total users, new users, engagement rate, conversions, and a sessions breakdown for desktop, mobile, tablet, and smart TV. There is a bar chart for sessions with comparison bars for the previous year totals.

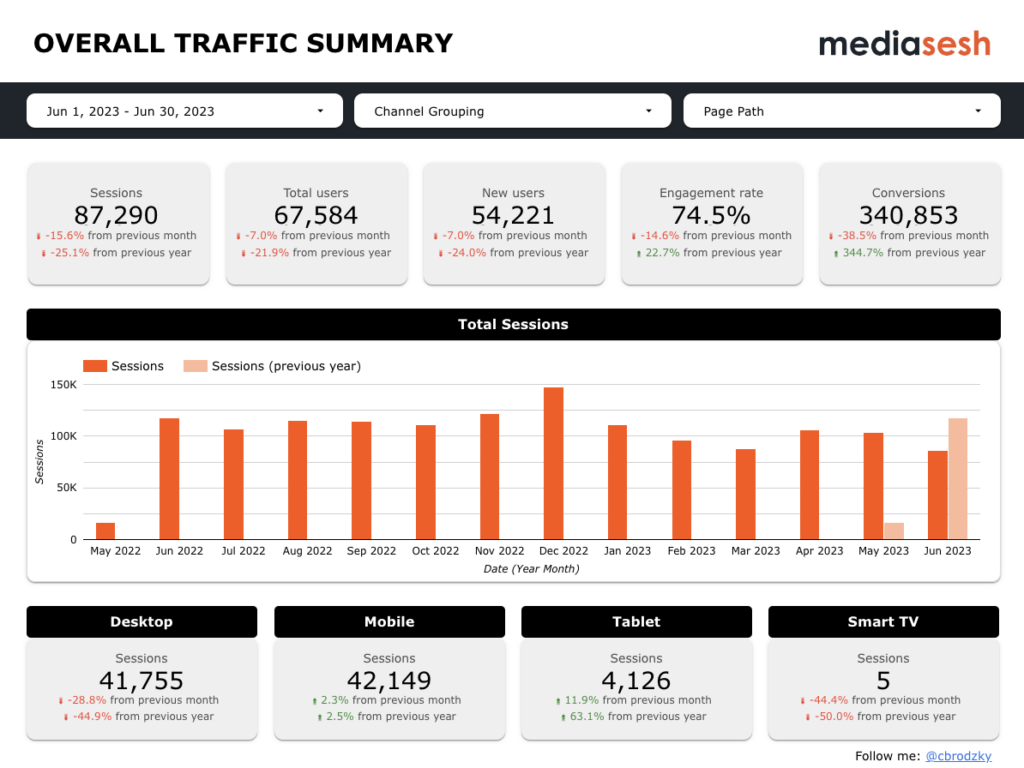
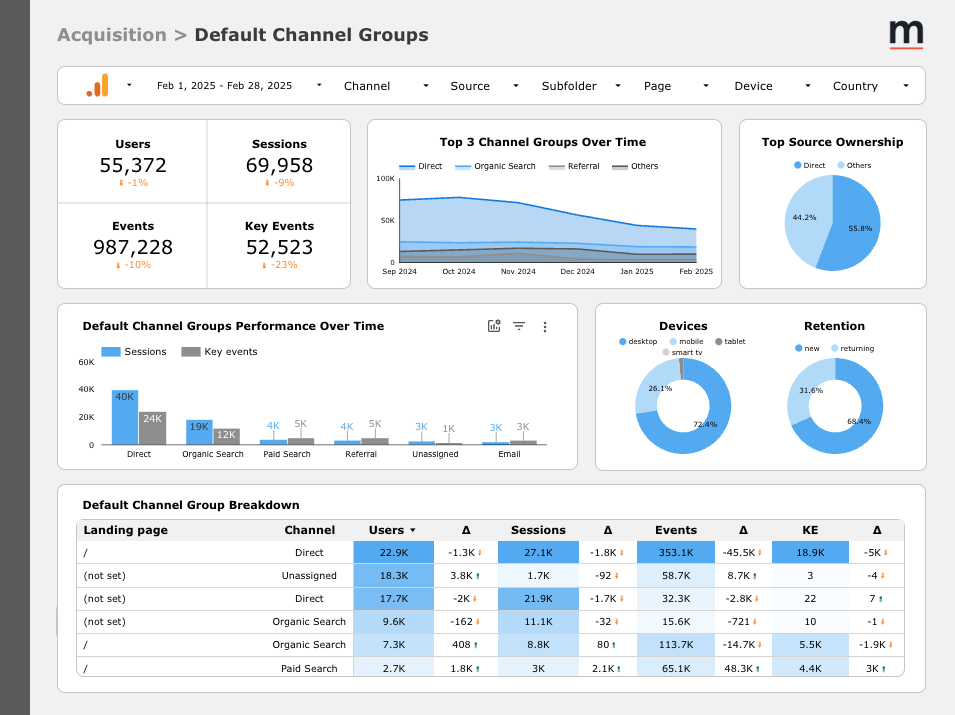
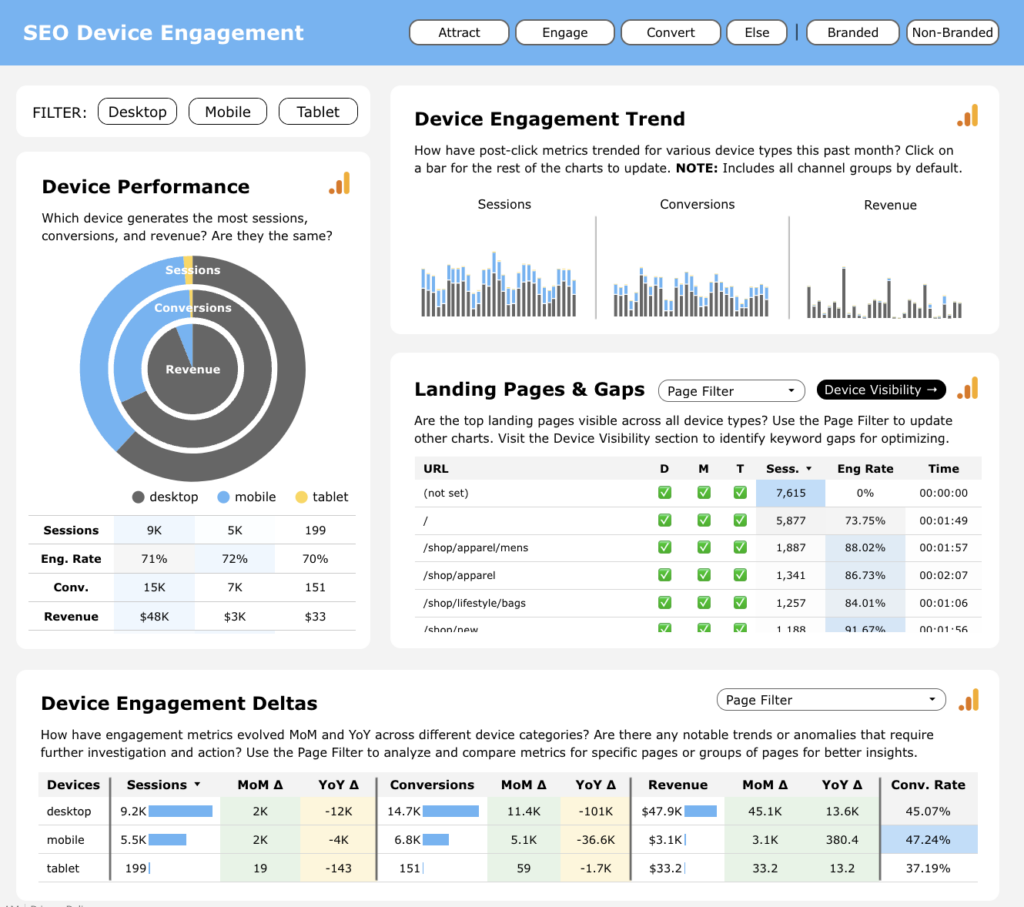
GA4 SEO Looker Studio Template

Unlock the full potential of your website’s analytics with this Google Analytics 4 SEO Looker Studio template. Tailored for SEO analysts, marketers, and business owners, this template uses an intuitive interface to transform your GA4 data into actionable insights with ease and efficiency. Track key performance indicators and other important metrics to make informed business decisions.

A Looker Studio dashboard titled "GSC Landing Page Optimization Opportunities. It has filter options asking for GSC Property, Landing Page URL, and Query (optional). There's a line chart in the middle with three charts below it showing ranking keywords for Rank #1-10, Rank #11-20, and Rank #21+.

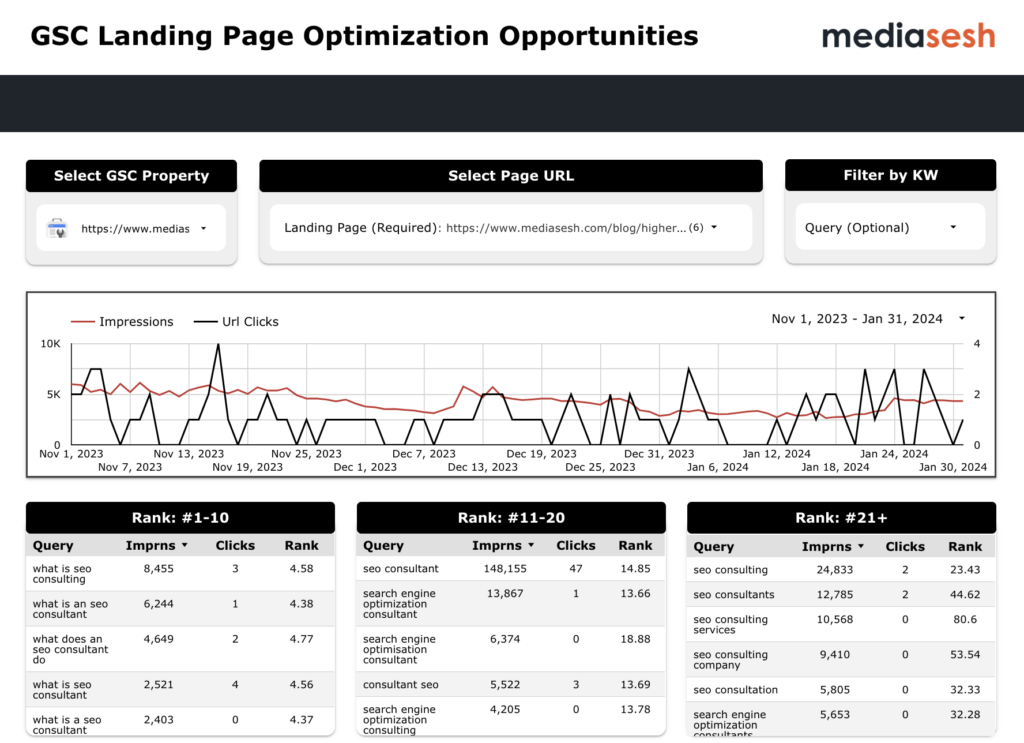
Google Search Console Looker Studio Template for Optimization Opportunities

Elevate your SEO strategy with this keyword optimization dashboard. Designed for SEO professionals, content creators, and digital marketers, this Looker Studio dashboard leverages Google Search Console data to unveil hidden opportunities for keyword optimization. Transform how you approach content and SEO with valuable insights that guide you to rank higher and capture more organic traffic.

A Looker Studio template titled "GSC SERP Visibility Summary". There are different boxes highlighting month over month and year over year deltas for impressions, clicks, CTR, and average rank. There is a line chart showing the trend for impressions and clicks over the past month. There are two other charts that show ranking keywords and URL-level data.

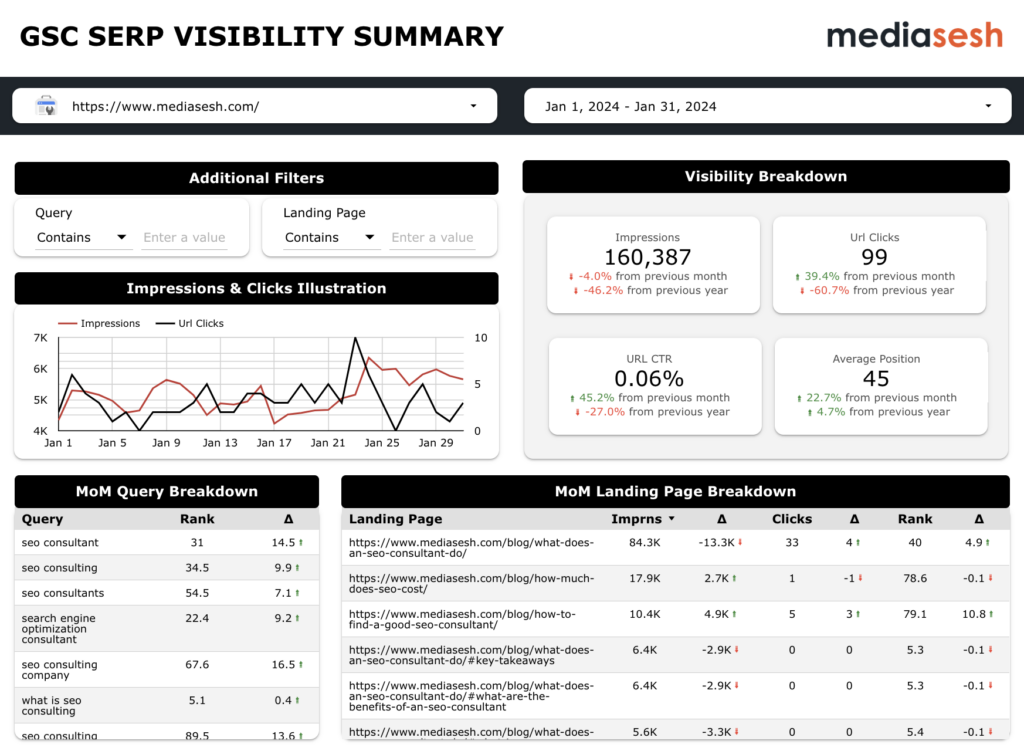
Google Search Console Looker Studio Template for SERP Visibility Summary

Maximize your online presence with this SERP visibility dashboard. Designed for SEO specialists, digital marketers, and website owners, this Google Data Studio template harnesses the power of Google Search Console data to provide a high-level view of your website’s performance in search results. Visualize your data to derive meaningful insights and make informed decisions to enhance your SERP visibility.

Other SEO Resources

A branded MediaSesh graphic with an orange background with light orange bubbles with a white box that contains the words "SEO Accessibility Resource. Learn. Hire. Help."

SEO Accessibility Resource

As SEOs, we’re in a great place to be part of the conversation and loop in the very people we are trying to support. Here are a few ways to learn, hire and help people with disabilities.

Branded MediaSesh image with white text on a patterned black background that reads "10 Questions to Ask Yourself As You Carve Your Path in the SEO Industry".

Carving Your SEO Path Presentation

In this presentation, I focus on how you can learn more about yourself in order to find your niche, get the money you want and deserve, and how you can make a difference. There’s a place for everyone in this industry – How are you carving your path? Where do you fit in?